Staff data analysis
The staff data analysis is informed by a snapshot of data as of July 2025.
The total number of staff employed at the University for 2025 is 1,877 FTE. Of the total 761 account for academic staff, 1051 account for support staff and 65 account for senior management.
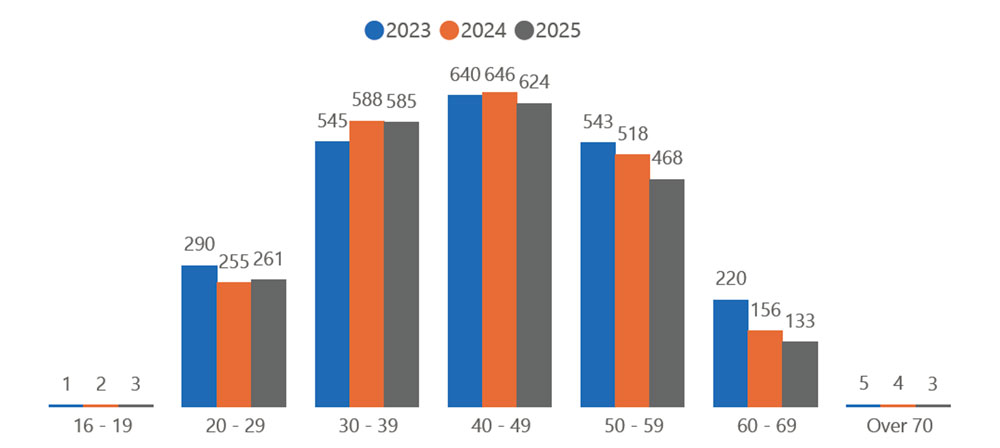
Age
The 40-49 age group remains the largest within our staff population, comprising 624 individuals. This is followed by the 30-39 age group, with 585 staff members. Since 2023, there has been a modest increase in staff within the 16-19 age group. The University remains committed to encouraging applications from younger individuals.
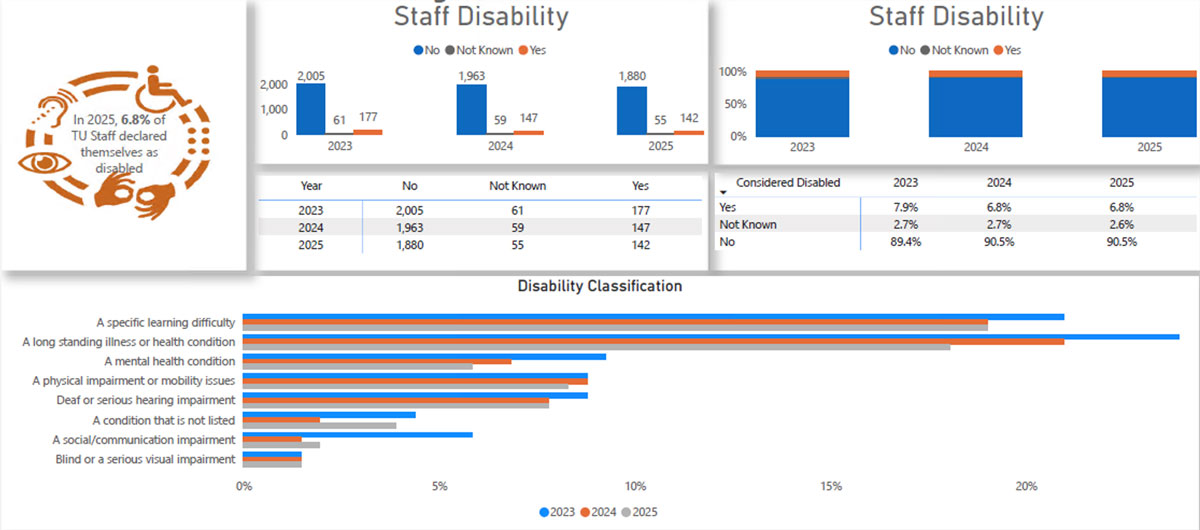
Disability
In 2025, the proportion of staff declaring a disability remained the same as in 2024 at 6.8%. A total of 90.5% of University staff reported having no disability. Teesside's proportion of disabled staff remains slightly below the higher education sector benchmark of 7.16%.
Benchmark Comparison
| Benchmark | 2023 | 2024 | 2025 | |
|---|---|---|---|---|
| Disabled | 7.16% | 8.1% | 7.0% | 7.0% |
| Non-disabled | 92.84% | 91.9% | 93.0% | 93.0% |
Survey: Equality in higher education: staff statistical report 2024
*For the purposes of benchmarking, all TU "Not Known" staff have been classified as 'non-disabled'.
Ethnicity
In 2025, the proportion of staff identifying as White ethnicity decreased slightly by 0.1%, from 81.2% in 2024 to 82.1%. All other ethnic groups experienced a marginal decrease, with the exception of Black staff, which increased by 0.1% to 4.1%. Among staff who identify as other than White British, 10.1% are Asian and 2.1% identify as Mixed. Overall, staff from ethnic minority backgrounds excluding not known/refused represent 17.8% of the workforce, which remains below the higher education sector benchmark of 19.1%.
| 2023 | 2024 | 2025 | |
|---|---|---|---|
| Not known/Refused | 0.7% | 0.9% | 1.3% |
| White | 84.4% | 81.2% | 81.1% |
| Asian | 8.8% | 10.1% | 10.1% |
| Black | 3.0% | 4.0% | 4.1% |
| Mixed | 1.7% | 2.2% | 2.1% |
| Other | 1.3% | 1.5% | 1.4% |
The groupings for ethnicity have been taken from the ONS guidance. Ethnicity Groupings
- Asian - Asian or Asian British: Bangladeshi, Asian or Asian British: Indian, Asian or Asian British: Pakistani, and other Asian background
- Black - black or black British: African, black or black British: Caribbean, and other black background
- Mixed
- Other ethnic background
- White - all white ethnic groups including white British
Benchmark Comparison
Source: Advancehe.ac.uk
Survey: Equality in higher education: staff statistical report 2024
| Benchmark | 2023 | 2024 | 2025 | |
|---|---|---|---|---|
| White | 80.9% | 85.0% | 82.0% | 82.2% |
| Ethnic minorities | 19.1% | 15.0% | 18.0% | 17.8% |
Note: Not Known/Refused TU Staff are not included in the benchmark comparison table, therefore totals may not add up to 100%. Ethnic Minorities consists of Asian, Black, Mixed and Other
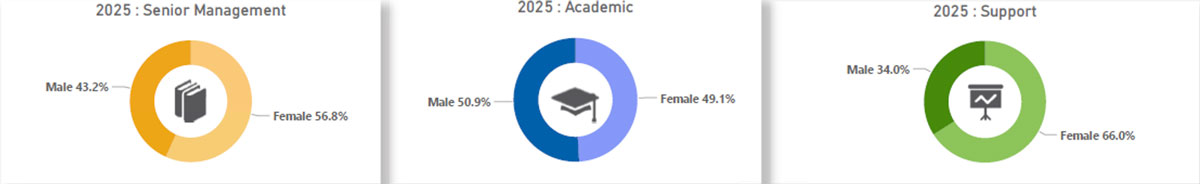
Gender
The University employs a higher proportion of female staff, 59.2% compared to male staff, 40.8%. In 2025, the gender balance within support staff shows a wider disparity, with females representing 66% and males representing 34%. Within senior management females represent 56.8% and males represent 43.2%. Among academic staff, however, males account for a slightly higher proportion at 50.9% compared to 49.1% for females. Benchmarking data indicates that the proportion of male senior management and support staff is below the sector benchmark, while the proportion of females is correspondingly higher.
2023
1327
59.1%
917
40.9%
2024
1287
59.3%
882
40.7%
2025
1229
59.2%
848
40.8%
Benchmark Comparison
Source: Advancehe.ac.uk
Survey: Equality in higher education: staff statistical report 2024
| Academic staff | Benchmark | 2023 | 2024 | 2025 |
|---|---|---|---|---|
| Male | 51.4% | 50.9% | 49.6% | 50.9% |
| Female | 48.6% | 49.1% | 54.4% | 49.1% |
| Senior Management and Support Staff | Benchmark | 2023 | 2024 | 2025 |
|---|---|---|---|---|
| Male | 37.2% | 35.2% | 34.8% | 34.4% |
| Female | 62.8% | 64.8% | 65.2% | 65.6% |
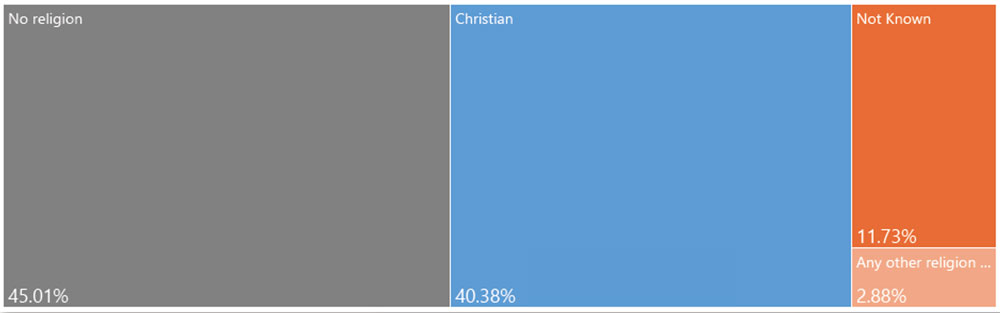
Religion
The amount of staff stating Christianity as their religion has reduced from 35.4% in 2024 to 34.5% in 2025. Staff declaring that they have no religion has increased by 1.4% to 38.4% in 2025. The not known figure for the University is 10% which is significantly below the benchmark figure of 24.9%.
Benchmark Comparison
Source: Advancehe.ac.uk
Equality in higher education: staff statistical report 2024
| Benchmark | 2023 | 2024 | 2025 | ||||
|---|---|---|---|---|---|---|---|
| No religion | 33.40% | 37.4% | 839 | 37.0% | 803 | 38.4% | 798 |
| Buddhist | 0.7% | 0.5% | 12 | 0.6% | 12 | 0.6% | 13 |
| Christian | 22.30% | 34.8% | 780 | 35.4% | 767 | 34.5% | 716 |
| Hindu | 1.5% | 1.4% | 32 | 1.9% | 41 | 1.9% | 40 |
| Muslim | 3.1% | 5.3% | 119 | 6.2% | 135 | 6.3% | 130 |
| Sikh | 0.4% | 0.3% | 7 | 0.2% | 4 | 0.2% | 5 |
| Spiritual | 0.1% | 2 | 0.5% | 10 | 0.6% | 12 | |
| Any other religion or belief | 3.0% | 3.2% | 72 | 2.9% | 63 | 2.5% | 51 |
| Prefer not to say | 10.3% | 5.2% | 117 | 5.2% | 112 | 5.0% | 104 |
| Not known | 24.9% | 11.8% | 264 | 10.2% | 222 | 10.0% | 208 |
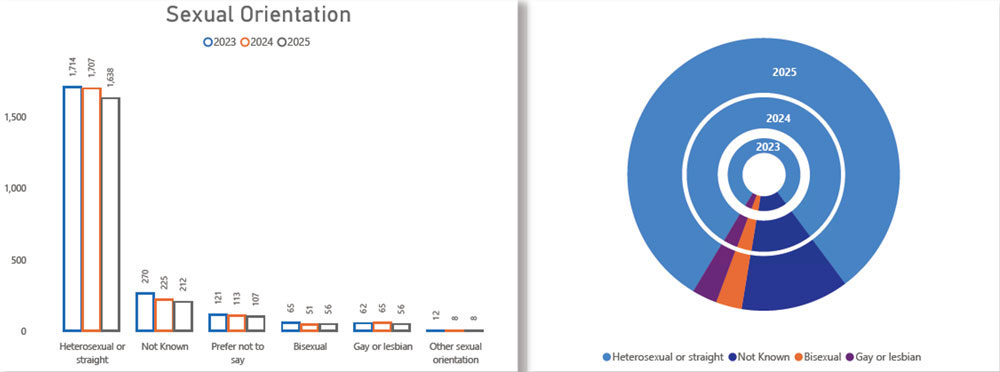
Sexual Orientation
In 2025, 2.7% of staff identified as gay or lesbian, representing a slight decrease of 0.3% from 2024. The majority of staff, 78.9% identified as heterosexual. The proportion of staff who preferred not to disclose their sexual orientation remained the same as 2024 at 5.2%. Sexual orientation is unknown for 10.2% of staff, a figure significantly lower than the higher education sector benchmark of 24.5%.
Benchmark Comparison
Source: Advancehe.ac.uk
Equality in higher education: staff statistical report 2024
| Benchmark | 2023 | 2024 | 2025 | |
|---|---|---|---|---|
| Bisexual | 2.8% | 2.9% | 2.4% | 2.7% |
| Gay or lesbian | 2.8% | 2.8% | 3.0% | 2.7% |
| Heterosexual | 58.6% | 76.4% | 78.7% | 78.9% |
| Other sexual orientation | 0.7% | 0.5% | 0.4% | 0.4% |
| Prefer not to say | 11.0% | 5.4% | 5.2% | 5.2% |
| Not known | 24.5% | 12.0% | 10.4% | 10.2% |