Student data analysis
The data presented includes a range of information broken down for each protected characteristics as of July 2024.
The data highlights changes in numbers of students with a given characteristic over the years and the proportion of students with a given characteristic against the total University student population.

The data covers the characteristics of age, disability, race, gender, religion and belief, sexual orientation and gender identify.
Age
Change 23/24 to 24/25 identifies the change in the measure between the two year.
Difference from overall identifies the difference in the measure compared to the overall student population.
No data is available at the time of producing this report for degrees due to the resit assessment boards occurring in September.
| Measure | 2023/24 | 2024/25 | Change 23/24 to 24/25 | 2023/24 | 2024/25 | Change 23/24 to 24/25 | Diff from overall | 2023/24 | 2024/25 | Change 23/24 to 24/25 | Diff from overall |
|---|---|---|---|---|---|---|---|---|---|---|---|
| Overall | 25 - 49 | 50+ | |||||||||
| Full Time Enrolments | 17,290 | 13,545 | -21.7% | 8,640 | 5,380 | -37.7% | -16.1% | 235 | 180 | -21.9% | -0.2% |
| Part Time Enrolments | 7,760 | 7,510 | -3.2% | 5,360 | 5,190 | -3.2 | +0.1% | 800 | 715 | -11.1% | -7.9% |
| Progression - % Pass/Proceed | 85.3% (7,600/8,910) |
87.0% (2,555/2,935) |
83.3% (125/150) |
||||||||
| Good Honours | 73.4% (1,975/2,690) |
73.7% (720/975) |
75.0% (20/30) |
||||||||
| UCAS Tariff (FT, Degree, Home)* | 113 | - | - | - | - | - | - | - | - | ||
| Graduate Outcomes (FT, Degree, Home)** | 79.2% (870/1,100) |
90.7% (290/320) |
82.4% (15/15) |
||||||||
* Based on students aged under 21 on entry
** Based on 2021/22 Graduate Outcomes survey.
2024/25 enrolled students (all years, all modes)
| Age group | Full time | Part time | Total | Full time | Part time | Total | Full time | Part time | Total |
|---|---|---|---|---|---|---|---|---|---|
| 2022/23 | 2023/24 | 2024/25 | |||||||
| Under 21 | 4,666 | 550 | 5,215 | 4,540 | 660 | 5,200 | 4,500 | 695 | 5,195 |
| 21 - 24 | 3,970 | 835 | 4,805 | 3,875 | 935 | 4,810 | 3,480 | 910 | 4,390 |
| 25 - 49 | 8,960 | 5,135 | 14,095 | 8,640 | 5,360 | 14,000 | 5,380 | 5,190 | 10,575 |
| Over 50 | 195 | 735 | 930 | 235 | 800 | 1,035 | 180 | 715 | 895 |
| Total | 17,790 | 7,255 | 25,045 | 17,290 | 7,760 | 25,045 | 13,545 | 7,510 | 21,050 |
| Over 25 | 9,155 | 5,875 | 15,025 | 8,870 | 6,165 | 15,035 | 5,565 | 5,905 | 11,470 |
| % over 25 | 51.5% | 80.9% | 60.0% | 51.3% | 79.5% | 60.0% | 41.1% | 78.6% | 54.5% |
*Analysis is based on the students' age on entry to their course.
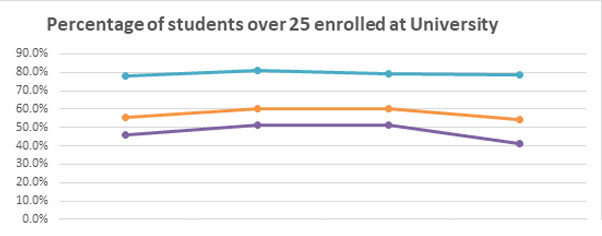
| 2021/2022 | 2022/2023 | 2023/2024 | 2024/2025 | |
|---|---|---|---|---|
| Full Time | 46.2% | 51.5% | 51.3% | 41.1% |
| Part Time | 77.9% | 80.9% | 79.5% | 78.6% |
| Total | 55.8% | 60.0% | 60.6% | 54.5% |
The percentage of students aged 25 and above has remained at the same level for the previous two years, before a 5.5% decrease for 2024/25.
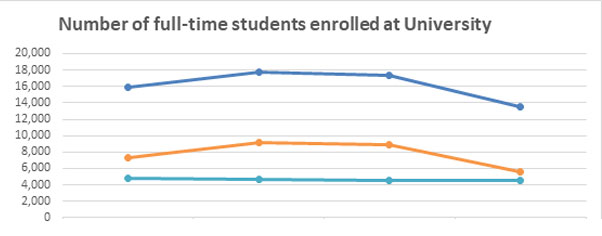
| 2021/2022 | 2022/2023 | 2023/2024 | 2024/2025 | |
|---|---|---|---|---|
| Under 21 | 4,785 | 4,665 | 4,540 | 4,500 |
| Over 25 | 7,320 | 9,155 | 8,870 | 5,565 |
| Total | 15,845 | 17,790 | 17,290 | 13,545 |
The number of students aged over 25 has seen a decrease in the current academic year.

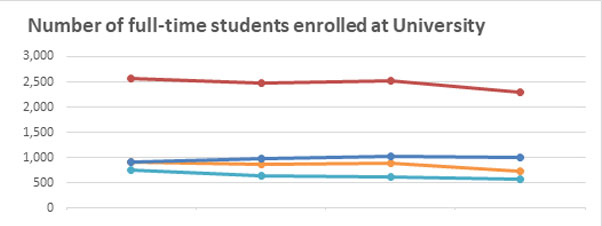
| 2021/2022 | 2022/2023 | 2023/2024 | 2024/2025 | |
|---|---|---|---|---|
| Under 21 | 645 | 550 | 660 | 695 |
| Over 25 | 5,335 | 5,875 | 6,165 | 5,905 |
| Total | 6,855 | 7,255 | 7,760 | 7,510 |
Students aged under 21 has seen slight increases in numbers since 2022/23.
Benchmark comparison: there is no available benchmarking data for 2025, benchmarking is based on 2024 data.
Source: HESA
| Age Group | Full Time | Part Time | Total | Full Time | Part Time | Total |
|---|---|---|---|---|---|---|
| Teesside University | National Data | |||||
| 2023/24 | 2023/24 | |||||
| Under 21 | 4,540 | 660 | 5,200 | 1,026,215 | 44,295 | 1,070,510 |
| 21 - 24 | 3,875 | 935 | 4,810 | 689,790 | 84,205 | 773,990 |
| 25 and over | 8,875 | 6,160 | 15,035 | 621,535 | 438,210 | 1,059,745 |
| Total* | 17,290 | 7,760 | 25,045 | 2,337,595 | 566,825 | 2,904,425 |
| % over 25 | 51.3% | 79.4% | 60.0% | 60.0% | 77.3% | 36.5% |
*Includes a number of students where their age is not recorded
Disability
This report gives information about disabled students at Teesside University. Each section details the comparisons between total students as well as those who have either declared a disability in their student record or those in receipt of a Disabled Student Allowance.
Change 23/24 to 24/25 identifies the change in the measure between the two years. Difference from overall identifies the difference in the measure compared to the overall student population. No data is available at the time of producing this report for degrees due to the resit assessment boards occurring in September.
| Measure | 2023/24 | 2024/24 | Change 23/24 to 24/25 | 2023/24 | 2024/24 | Change 23/24 to 24/25 | Diff from overall | 2023/24 | 2024/24 | Change 23/24 to 24/25 | Diff from overall |
|---|---|---|---|---|---|---|---|---|---|---|---|
| Overall | Declared Disability | DSA Recipient | |||||||||
| Full Time Enrolments | 17,290 | 13,545 | -21.7% | 2,530 | 2,295 | -9.3% | +12.4% | 755 | 640 | -15.7% | +5.9% |
| Part Time Enrolments | 7,760 | 7,510 | -3.2% | 1,175 | 1,195 | +2.0% | +5.2% | 110 | 95 | -15.3% | -12.1% |
| Progression - % Pass/Proceed | 85.3% (7,600/8,910) |
82.4% (1,790/2,170) |
85.8% (580/675) |
||||||||
| Good Honours | 73.4% (1,975/2,690) |
68.5% (400/585) |
69.1% (155/225) |
||||||||
| UCAS Tariff (FT, Degree, Home)* | 113 | 105 | 124 | ||||||||
| Graduate Outcomes (FT, Degree, Home)** | 79.2% (870/1,100) |
81.9% (225/275) |
89.4% (120/130) |
||||||||
* Based on students aged under 21.
** Based on 2021/22 Graduate Outcomes surveys.
2024/25 enrolled students (all years, all modes)
| Disability | Full time | Part time | Total | Full time | Part time | Total | Full time | Part time | Total |
|---|---|---|---|---|---|---|---|---|---|
| 2022/23 | 2023/24 | 2024/25 | |||||||
| Specific learning difficulty | 635 | 340 | 975 | 615 | 365 | 980 | 570 | 410 | 980 |
| Physical impairment or mobility issue | 40 | 20 | 60 | 40 | 30 | 70 | 30 | 20 | 50 |
| Long standing illness | 190 | 90 | 280 | 185 | 120 | 305 | 160 | 95 | 255 |
| Disability not listed above | 135 | 45 | 180 | 140 | 35 | 175 | 105 | 30 | 135 |
| Deaf or hearing impaired | 35 | 25 | 60 | 35 | 35 | 70 | 30 | 30 | 60 |
| Blind or visually impaired | 15 | 10 | 30 | 20 | 15 | 35 | 10 | 10 | 20 |
| Multiple disabilities | 560 | 220 | 780 | 600 | 295 | 895 | 655 | 310 | 970 |
| Mental health condition | 715 | 210 | 925 | 735 | 235 | 970 | 585 | 250 | 835 |
| Social/communication impairment | 150 | 25 | 175 | 160 | 35 | 195 | 145 | 40 | 185 |
| Development condition since childhood | 5 | 5 | 5 | 5 | 5 | 5 | 0 | 5 | |
| Total disabled | 2,480 | 985 | 3,465 | 2,530 | 1,175 | 3,705 | 2,295 | 1,195 | 3,495 |
| Not known disability | 15,310 | 6,270 | 21,580 | 14,755 | 6,585 | 21,340 | 11,245 | 6,310 | 17,560 |
| Total | 17,790 | 7,255 | 25,045 | 17,290 | 7,760 | 25,045 | 13,545 | 7,510 | 21,050 |
| % declaring disability | 14.0% | 13.6% | 13.8% | 14.6% | 15.1% | 14.8% | 17.0% | 15.9% | 16.6% |
Students who are receiving Disabled Students' Allowance
| 2022/2023 | 2023/2024 | 2024/2025 | ||||
|---|---|---|---|---|---|---|
| Full-time students | 860 | 4.8% | 755 | 4.4% | 640 | 4.7% |
| Part-time students | 130 | 1.8% | 110 | 1.4% | 95 | 1.3% |

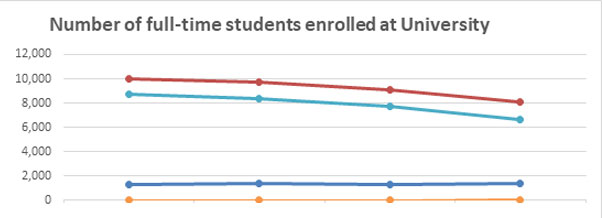
| 2021/2022 | 2022/2023 | 2023/2024 | 2024/2025 | |
|---|---|---|---|---|
| Full Time | 16.3% | 14% | 14.6% | 17.0% |
| Part Time | 12.6% | 13.6% | 15.1% | 15.9% |
| Total | 15.2% | 13.8% | 14.8% | 16.6% |
The percentage of both full time and part time disabled students has increased year on year since 2022/23.
| 2021/2022 | 2022/2023 | 2023/2024 | 2024/2025 | |
|---|---|---|---|---|
| DSLD | 745 | 635 | 615 | 570 |
| MHC & ASC | 910 | 865 | 890 | 730 |
| Other Disability | 920 | 980 | 1,025 | 995 |
| Total Disability | 2,575 | 2,480 | 2,530 | 2,295 |
The number of full-time students that have declared a Specific Learning Difficulty (DSLD) has decreased each year. In 2024/25, there has been decreases in all declared disabilities.

| 2021/2022 | 2022/2023 | 2023/2024 | 2024/2025 | |
|---|---|---|---|---|
| DSLD | 300 | 340 | 365 | 410 |
| MHC & ASC | 235 | 235 | 270 | 290 |
| Other Disability | 330 | 410 | 540 | 500 |
| Total Disability | 860 | 985 | 1,175 | 1,195 |
Part time students with a declared disability continues to rise, with a smaller increase for current academic year due to a slight drop in numbers for other disability.
Benchmark comparison: there is no available benchmarking data for 2025, benchmarking is based on 2024 data.
Source: HESA
| Disability | Full Time | Part Time | Total | Full Time | Part Time | Total |
|---|---|---|---|---|---|---|
| Teesside University | National Data | |||||
| 2023/24 | 2023/24 | |||||
| Known disability | 2,530 | 1,175 | 3,705 | 402,540 | 111,775 | 514,310 |
| No Known Disability | 14,755 | 6,585 | 21,340 | 1,935,060 | 455,055 | 2,390,110 |
| Total | 17,290 | 7,760 | 25,045 | 2,337,595 | 566,825 | 2,904,425 |
| % Known disability | 14.6% | 15.1% | 14.8% | 17.2% | 19.7% | 17.7% |
Ethnic origin
This report gives information regarding the ethnic origin of students at Teesside University. Each section details the comparisons between total students and those classed as Non-White (details below).
Students have been grouped into one of six groups from.White, Other, Asian, Black, Chinese and Not Known. These are grouped into three groups White, Non-White and Not Known. The above groups only apply to UK domiciled students.
Change 23/24 to 24/25 identifies the change in the measure between the two years. Difference from overall identifies the difference in the measure compared to the overall student population. No data is available at the time of producing this report for degrees due to the resit assessment boards occurring in September.
| Measure | 2023/24 | 2024/25 | Change 23/24 to 24/25 | 2023/24 | 2024/25 | Change 23/24 to 24/25 | Diff from overall | 2023/24 | 2024/25 | Change 23/24 to 24/25 | Diff from overall |
|---|---|---|---|---|---|---|---|---|---|---|---|
| Overall | White | Non-White* exc Info refused | |||||||||
| Full Time Enrolments | 17,290 | 13,545 | -21.7% | 7,760 | 6,600 | -14.2% | +7.5% | 1,325 | 1,415 | +6.8% | +28.5% |
| Part Time Enrolments | 7,760 | 7,510 | -3.2% | 6,425 | 6,090 | -5.2% | -2.0% | 945 | 970 | +2.9% | +6.1% |
| Progression - % Pass/Proceed | 85.3% (7,600/8,910) |
85.3% (5,930/6,950) |
82.4% (920/1,115) |
||||||||
| Good Honours | 73.4% (1,975/2,690) |
75.1% (1,575/2,100) |
66.1% (185/275) |
||||||||
| UCAS Tariff (FT, Degree, Home)* | 113 | 114 | 111 | ||||||||
| Graduate Outcomes (FT, Degree, Home)** | 79.2% (870/1,100) |
80.4% (765/950) |
71.7% (105/145) |
||||||||
* Based on students aged under 21.
** 2021/22 Graduate Outcomes surveys.
2024/25 enrolled students (all years, all modes)
| Ethnic group | Full time | Part time | Total | Full time | Part time | Total | Full time | Part time | Total |
|---|---|---|---|---|---|---|---|---|---|
| 2022/23 | 2023/24 | 2024/25 | |||||||
| White | 8,365 | 6,040 | 14,405 | 7,760 | 6,425 | 14,185 | 6,660 | 6,090 | 12,750 |
| Other | 350 | 225 | 580 | 360 | 200 | 560 | 380 | 195 | 570 |
| Asian | 665 | 315 | 980 | 645 | 345 | 990 | 640 | 385 | 1,020 |
| Black | 300 | 350 | 650 | 300 | 385 | 685 | 370 | 380 | 750 |
| Chinese | 25 | 25 | 50 | 20 | 15 | 35 | 21 | 15 | 45 |
| Not Known | 20 | 40 | 65 | 20 | 45 | 65 | 35 | 75 | 110 |
| Total | 9,730 | 6,995 | 16,725 | 9,105 | 7,415 | 16,520 | 8,110 | 7,135 | 15,245 |
| Non-white | 1,345 | 910 | 2,255 | 1,325 | 945 | 2,270 | 1,415 | 970 | 2,385 |
| % White | 86.0% | 86.4% | 86.1% | 85.2% | 86.7% | 85.9% | 82.1% | 85.3% | 83.6% |
| % Non-white | 13.8% | 13.0% | 13.5% | 14.5% | 12.7% | 13.7% | 17.4% | 13.6% | 15.7% |
| % Not known | 0.2% | 0.6% | 0.4% | 0.2% | 0.6% | 0.4% | 0.4% | 1.0% | 0.7% |

| 2021/2022 | 2022/2023 | 2023/2024 | 2024/2025 | |
|---|---|---|---|---|
| Full Time | 13.1% | 13.8% | 14.5% | 17.4% |
| Part Time | 10.7% | 13.0% | 12.7% | 13.6% |
| Total | 12.1% | 13.5% | 13.7% | 15.7% |
There has been an2.2% increase in the total percentage of non-white ethnicity students from 2022/23 (13.5%) to 2024/25 (15.7%).
| 2021/2022 | 2022/2023 | 2023/2024 | 2024/2025 | |
|---|---|---|---|---|
| White | 8,690 | 8,365 | 7,760 | 6,660 |
| Not Known | 20 | 20 | 20 | 35 |
| Non-White | 1,310 | 1,345 | 1,325 | 1,415 |
| Total | 10,020 | 9,730 | 9,105 | 8,110 |
The number of non-white full-time enrolments has slightly fluctuated over the last three years with an increase of 90 students in 24/25. Not Known has also seen an increase after remaining static for the past three years.

| 2021/2022 | 2022/2023 | 2023/2024 | 2024/2025 | |
|---|---|---|---|---|
| White | 5,805 | 6,040 | 6,425 | 6,090 |
| Not Known | 45 | 40 | 45 | 75 |
| Non-White | 700 | 910 | 945 | 970 |
| Total | 6,550 | 6,995 | 7,415 | 7,135 |
All groups saw an increase in 2023/24, after which White sees a small decrease in 2024/25. The number of Non-White has seen a steady increase since 2022/23.
Benchmark comparison: there is no available benchmarking data for 2025, benchmarking is based on 2024 data.
Source: HESA
Ethnicity (UK domiciled students only)
| Ethnic Group | Full Time | Part Time | Total | Full Time | Part Time | Total |
|---|---|---|---|---|---|---|
| Teesside University | National Data | |||||
| 2023/24 | 2023/24 | |||||
| White | 7,760 | 6,425 | 14,185 | 1,083,150 | 396,985 | 1,480,135 |
| Black | 300 | 385 | 685 | 147,635 | 36,055 | 183,690 |
| Asian | 665 | 360 | 1,025 | 238,940 | 49,090 | 288,030 |
| Other (inc Mixed) | 360 | 200 | 560 | 128,445 | 25,905 | 154,350 |
| Not Known | 20 | 45 | 65 | 42,330 | 19,530 | 61,860 |
| Total (UK Domiciled) | 9,105 | 7,415 | 15,520 | 1,640,495 | 527,560 | 2,168,060 |
| Non-White | 1,325 | 945 | 2,270 | 515,020 | 111,050 | 626,070 |
| % White (exc not known) | 85.4% | 87.2% | 86.2% | 67.8% | 78.1% | 70.3% |
| % Non-White (exc not known) | 14.6% | 12.8% | 13.8% | 32.2% | 21.9% | 29.7% |
| % Not Known | 0.2% | 0.6% | 0.4% | 2.6% | 3.7% | 2.9% |
Gender
This report gives information about the gender of students at Teesside University. Each section details the comparisons between total students and those who are female or male.
Change 23/24 to 24/25 identifies the change in the measure between the two years. Difference from overall identifies the difference in the measure compared to the overall student population. No data is available at the time of producing this report for degrees due to the resit assessment boards occurring in September.
| Measure | 2023/24 | 2024/25 | Change 23/24 to 24/25 | 2023/24 | 2024/25 | Change 23/24 to 24/25 | Diff from overall | 2023/24 | 2024/25 | Change 23/24 to 24/25 | Diff from overall |
|---|---|---|---|---|---|---|---|---|---|---|---|
| Overall | Male | Female | |||||||||
| Full Time Enrolments | 17,290 | 13,545 | -21.7% | 7,535 | 6,155 | -18.3% | +3.4% | 9,715 | 7,340 | -24.4% | -2.8 |
| Part Time Enrolments | 7,760 | 7,510 | -3.2% | 3,220 | 3,390 | +5.3% | +8.5% | 4,530 | 4,105 | -9.3% | -6.1% |
| Progression - % Pass/Proceed | 85.3% (7,600/8,910) |
83.3% (2,615/3,140) |
86.4% (4,955/5,735) |
||||||||
| Good Honours | 73.4% (1,975/2,690) |
73.4% (740/1,010) |
73.7% (1,230/1,670) |
||||||||
| UCAS Tariff (FT, Degree, Home)* | 113 | 111 | 114 | ||||||||
| Graduate Outcomes (FT, Degree, Home)** | 79.2% (870/1,100) |
70.9% (285/400) |
83.9% (585/700) |
||||||||
* Based on students aged under 21.
** 2021/22 Graduate Outcomes surveys.
| Measure | Diff from overall | Diff from Female | Diff from overall | Diff from Male |
|---|---|---|---|---|
| Male | Female | |||
| Full Time Enrolments | +3.4% | +6.1% | -2.8% | -6.1% |
| Part Time Enrolments | +8.5% | +14.7% | -6.1% | -14.7% |
| Progression - % Pass/Proceed | ||||
| Good Honours | ||||
| UCAS Tariff (FT, Degree, Home)* | ||||
| Graduate Outcomes (FT, Degree, Home)** | ||||
2024/25 enrolled students (all years, all modes)
| Gender | Full time | Part time | Total | Full time | Part time | Total | Full time | Part time | Total |
|---|---|---|---|---|---|---|---|---|---|
| 2022/23 | 2023/24 | 2024/25 | |||||||
| Male | 7,745 | 2,910 | 10,655 | 7,535 | 3,220 | 10,755 | 6,155 | 3,390 | 9,545 |
| Female | 10,015 | 4,340 | 14,335 | 9,715 | 4,530 | 14,245 | 7,340 | 4,105 | 11,450 |
| Total* | 17,790 | 7,255 | 25,045 | 17,290 | 7,760 | 25,045 | 13,545 | 7,510 | 21,050 |
| % Male | 43.5% | 40.1% | 42.5% | 43.6% | 41.5% | 42.9% | 45.5% | 45.1% | 45.3% |
| % Female | 56.3% | 59.8% | 57.3% | 56.2% | 58.4% | 56.9% | 54.2% | 54.7% | 54.5% |
*Includes a number of students who have selected Other or Information Refused / Unknown as their gender

| 2021/2022 | 2022/2023 | 2023/2024 | 2024/2025 | |
|---|---|---|---|---|
| Full Time | 56.4% | 56.3% | 56.2% | 54.2% |
| Part Time | 56.8% | 59.8% | 58.4% | 54.7% |
| Total | 56.5% | 57.3% | 56.9% | 54.4% |
Female students make up 54.4% of the student cohort at the University for 2024/25 academic year.

| 2021/2022 | 2022/2023 | 2023/2024 | 2024/2025 | |
|---|---|---|---|---|
| Male | 6,905 | 7,745 | 7,535 | 6,155 |
| Female | 8,935 | 10,015 | 9,715 | 7,340 |
| Total | 15,845 | 17,790 | 17,290 | 13,545 |
There has been a reduction in overall enrolments since 2023/24.
| 2021/2022 | 2022/2023 | 2023/2024 | 2024/2025 | |
|---|---|---|---|---|
| Male | 2,950 | 2,910 | 3,220 | 3,390 |
| Female | 3,890 | 4,340 | 4,530 | 4,105 |
| Total | 6,855 | 7,255 | 7,760 | 7,510 |
Benchmark comparison: there is no available benchmarking data for 2025, benchmarking is based on 2024 data.
Source: HESA
| Gender | Full Time | Part Time | Total | Full Time | Part Time | Total |
|---|---|---|---|---|---|---|
| Teesside University | National Data | |||||
| 2023/24 | 2023/24 | |||||
| Male | 7,535 | 3,220 | 10,755 | 1,036,455 | 210,425 | 1,246,880 |
| Female | 9,715 | 4,530 | 14,245 | 1,292,475 | 4353,330 | 1,645,805 |
| Total* | 17,290 | 7,760 | 25,045 | 2,337,595 | 566,825 | 2,904,425 |
| % Male | 43.7% | 41.5% | 43.0% | 44.3% | 37.1% | 42.9% |
| % Female | 56.3% | 58.5% | 57.0% | 55.5% | 62.7% | 56.9% |
*Includes a number of students who have selected Other or Information Refused / Unknown as their gender.
Gender identity
This report gives information regarding the gender identity of students at Teesside University. Each section details the comparisons between total students who have the same gender as they were born with.
Students have been grouped into one of three bands namely:
- Yes - their gender is the same
- No - their gender has changed
- Information refused/blank.
Change 23/24 to 24/25 identifies the change in the measure between the two years. Difference from overall identifies the difference in the measure compared to the overall student population. No data is available at the time of producing this report for degrees due to the resit assessment boards occurring in September.
| Measure | 2023/24 | 2024/25 | Change 23/24 to 24/25 | 2023/24 | 2024/25 | Change 23/24 to 24/25 | Diff from overall | 2023/24 | 2024/25 | Change 23/24 to 24/25 | Diff from overall |
|---|---|---|---|---|---|---|---|---|---|---|---|
| Overall | Yes | No | |||||||||
| Full Time Enrolments | 17,290 | 13,545 | -21.7% | 16,920 | 13,170 | -22.2% | -0.5% | 220 | 195 | -11.3% | +10.3% |
| Part Time Enrolments | 7,760 | 7,510 | -3.2% | 7,620 | 7,380 | -3.2% | +0.1% | 40 | 45 | +9.5% | +12.7% |
| Progression - % Pass/Proceed | 85.3% (7,600/8,910) |
85.4% (7,370/8,630) |
83.9% (150/180) |
||||||||
| Good Honours | 73.4% (1,975/2,690) |
73.4% (1,930/2,630) |
69.7% (25/35) |
||||||||
| UCAS Tariff (FT, Degree, Home)* | 113 | 113 | 118 | ||||||||
| Graduate Outcomes (FT, Degree, Home)** | 79.2% (870/1,100) |
79.5% (855/1,075) |
75.0% (10/10) |
||||||||
* Based on students aged under 21.
** 2021/22 Graduate Outcomes surveys.
| Measure | 2023/24 | 2024/25 | Change 23/24 to 24/25 | 2023/24 | 2024/25 | Change 23/24 to 24/25 | Diff from overall |
|---|---|---|---|---|---|---|---|
| Overall | Information refused/Blank | ||||||
| Full Time Enrolments | 17,290 | 13,545 | -21.7% | 145 | 175 | +20.5% | +42.2% |
| Part Time Enrolments | 7,760 | 7,510 | -3.2% | 95 | 80 | -13.7% | -10.5% |
| Progression - % Pass/Proceed | 85.3% (7,600/8,910) |
80.2% (80/100) |
|||||
| Good Honours | 73.4% (1,975/2,690) |
76.7% (25/30) |
|||||
| UCAS Tariff (FT, Degree, Home)* | 113 | 138 | |||||
| Graduate Outcomes (FT, Degree, Home)** | 79.2% (870/1,100) |
57.1% (10/15) |
|||||
2024/25 enrolled students (all years, all modes)
| Gender ID | Full time | Part time | Total | Full time | Part time | Total | Full time | Part time | Total |
|---|---|---|---|---|---|---|---|---|---|
| 2022/23 | 2023/24 | 2024/25 | |||||||
| Yes | 17,395 | 7,000 | 24,395 | 16,920 | 7,620 | 24,545 | 13,170 | 7,380 | 20,550 |
| No | 145 | 45 | 190 | 220 | 40 | 265 | 195 | 45 | 240 |
| Information refused/blank | 245 | 215 | 260 | 145 | 95 | 240 | 175 | 80 | 260 |
| Total | 17,790 | 7,255 | 25,045 | 17,290 | 7,760 | 25,045 | 13,545 | 7,510 | 21,050 |
| % Yes | 97.8% | 96.5% | 97.4% | 97.9% | 98.2% | 98.0% | 97.3% | 98.3% | 97.6% |
| % No | 0.8% | 0.6% | 0.8% | 1.3% | 0.5% | 1.1% | 1.4% | 0.6% | 1.1% |
| % Information refused/blank | 1.4% | 2.9% | 1.8% | 0.8% | 1.2% | 1.0% | 1.3% | 1.1% | 1.2% |

| 2021/2022 | 2022/2023 | 2023/2024 | 2024/2025 | |
|---|---|---|---|---|
| Full Time | 1.0% | 0.8% | 1.3% | 1.4% |
| Part Time | 0.4% | 0.6% | 0.5% | 0.6% |
| Total | 0.8% | 0.8% | 1.1% | 1.1% |
There has been no overall change between 2023/24 and 2024/25 for students answering no to gender ID which remains at 1.1%.

| 2021/2022 | 2022/2023 | 2023/2024 | 2024/2025 | |
|---|---|---|---|---|
| Yes | 15,255 | 17,395 | 16,920 | 11,170 |
| No | 150 | 145 | 220 | 195 |
| Info Refused/Blank | 435 | 245 | 145 | 175 |
| Total | 15,845 | 17,790 | 17,290 | 13,545 |
The number of Information Refused has seen as slight increase of 30 (rounded) in 2024/25.
| 2021/2022 | 2022/2023 | 2023/2024 | 2024/2025 | |
|---|---|---|---|---|
| Yes | 5,090 | 7,000 | 7,620 | 7,380 |
| No | 30 | 45 | 40 | 55 |
| Info Refused/Blank | 1,730 | 215 | 95 | 80 |
| Total | 6,855 | 7,255 | 7,760 | 7,510 |
The number of Information Refused continues to decrease year on year with a drop of 135 (rounded) since 2022/23.
Religion and belief
This report gives information regarding the religion of students at Teesside University. Each section details the comparisons between total students and those classed as Non-Christian (details below).
Students have been grouped into one of ten groups:
- Christian
- Buddhist
- Hindu
- Jewish
- Muslim
- Sikh
- Spiritual
- Other
- No Religion
- Information Refused/Blank
Students are then grouped into four groups Christian, Non-Christian (includes Buddhist, Hindu, Jewish, Muslim, Sikh, Spiritual and other), No Religion and Information Refused.
Change 23/24 to 24/25 identifies the change in the measure between the two years. Difference from overall identifies the difference in the measure compared to the overall student population. No data is available at the time of producing this report for degrees due to the resit assessment boards occurring in September.
| Measure | 2023/24 | 2024/25 | Change 23/24 to 24/25 | 2023/24 | 2024/25 | Change 23/24 to 24/25 | Diff from overall | 2023/24 | 2024/25 | Change 23/24 to 24/25 | Diff from overall |
|---|---|---|---|---|---|---|---|---|---|---|---|
| Overall | Christian | Non-Christian | |||||||||
| Full Time Enrolments | 17,290 | 13,345 | -21.7% | 6,400 | 4,020 | -37.1% | -15.5% | 4,355 | 3,680 | -15.5% | +6.2% |
| Part Time Enrolments | 7,760 | 7,510 | -3.2% | 2,690 | 2,695 | +0.1% | +3.4% | 490 | 575 | +17.3% | +20.5% |
| Progression - % Pass/Proceed | 85.3% (7,600/8,910) |
86.6% (2.005/2.310) |
84.5% (905/1,070) |
||||||||
| Good Honours | 73.4% (1,975/2,690) |
72.1% (545/755) |
67.2% (220/325) |
||||||||
| UCAS Tariff (FT, Degree, Home)* | 113 | 115 | 110 | ||||||||
| Graduate Outcomes (FT, Degree, Home)** | 79.2% (870/1,100) |
81.8% (255/315) |
68.8% (75/110) |
||||||||
* Based on students aged under 21, so any students above this age are not included in analysis.
** Based on 2021/22 Graduate Outcomes surveys.
| Measure | 2023/24 | 2024/25 | Change 23/24 to 24/25 | 2023/24 | 2024/25 | Change 23/24 to 24/25 | Diff from overall | 2023/24 | 2024/25 | Change 23/24 to 24/25 | Diff from overall |
|---|---|---|---|---|---|---|---|---|---|---|---|
| Overall | No Religion | Info Refused/Blank | |||||||||
| Full Time Enrolments | 17,790 | 13,545 | -21.7% | 6,025 | 5,355 | -11.2% | +10.5% | 515 | 490 | -4.7% | +17.0% |
| Part Time Enrolments | 7,760 | 7,5410 | -3.2% | 3,840 | 3,890 | +1.3% | +4.6% | 740 | 350 | -52.8% | -49.6% |
| Progression - % Pass/Proceed | 85.3% 7,600/8,910) |
85.0% (4,470/5,265) |
83.8% (225/265) |
||||||||
| Good Honours | 73.4% (1,975/2,690) |
75.0% (1,160/1,545) |
81.5% (55/65) |
||||||||
| UCAS Tariff (FT, Degree, Home)* | 113 | 113 | 122 | ||||||||
| Graduate Outcomes (FT, Degree, Home)** | 79.2% (870/1,100) |
80.1% (530/665) |
53.8% (5/15) |
||||||||
* Based on students aged under 21, so any students above this age are not included in analysis.
** Based on 2021/22 Graduate Outcomes surveys.
2024/25 enrolled students (all years, all modes)
| Religion | Full time | Part time | Total | Full time | Part time | Total | Full time | Part time | Total |
|---|---|---|---|---|---|---|---|---|---|
| 2022/23 | 2023/24 | 2024/25 | |||||||
| Christian | 6,940 | 2,905 | 9,845 | 6,400 | 2,290 | 9,090 | 4,020 | 2,695 | 6,715 |
| Buddhist | 135 | 45 | 180 | 155 | 45 | 195 | 105 | 55 | 160 |
| Hindu | 1,670 | 95 | 1,765 | 1,800 | 65 | 1,820 | 1,605 | 120 | 1,725 |
| Jewish | 5 | 5 | 10 | 5 | 5 | 10 | 10 | 5 | 15 |
| Muslim | 1,940 | 225 | 2,170 | 2,145 | 260 | 2,405 | 1,740 | 270 | 2,010 |
| Sikh | 55 | 15 | 70 | 45 | 15 | 60 | 40 | 25 | 65 |
| Spiritual | 0 | 0 | 0 | ||||||
| Other | 210 | 120 | 330 | 210 | 110 | 320 | 180 | 100 | 280 |
| No religion | 6,350 | 3,585 | 9,935 | 6,025 | 3,840 | 9,865 | 5,355 | 3,890 | 9,240 |
| Information refused/blank | 485 | 260 | 745 | 515 | 740 | 1,250 | 490 | 350 | 835 |
| Total* | 17,790 | 7,255 | 25,045 | 17,290 | 7,760 | 25,045 | 13,545 | 7,510 | 21,050 |
| Non-Christian | 4,020 | 505 | 4,525 | 4,355 | 490 | 4,845 | 3,680 | 575 | 4,255 |
| % Christian | 39.0% | 40.0% | 39.3% | 37.0% | 34.7% | 36.3% | 29.7% | 35.9% | 31.9% |
| % Non-Christian | 22.6% | 7.0% | 18.1% | 25.2% | 6.3% | 19.3% | 27.2% | 7.7% | 20.2% |
| % No religion | 35.7% | 49.4% | 39.7% | 34.8% | 49.5% | 39.4% | 39.5% | 51.8% | 43.9% |
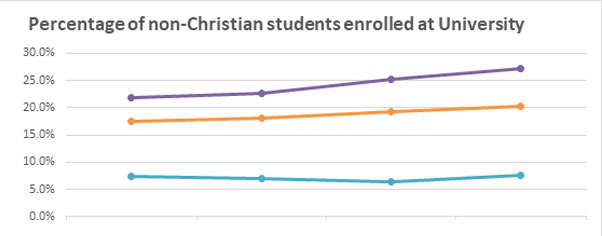
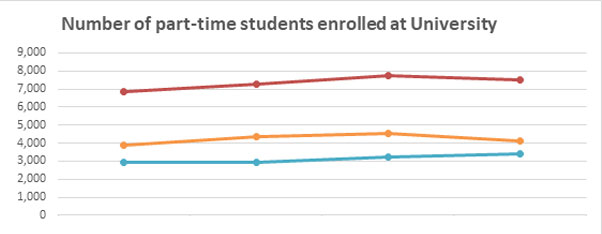
| 2021/2022 | 2022/2023 | 2023/2024 | 2024/2025 | |
|---|---|---|---|---|
| Full Time | 21.8% | 22.6% | 25.2% | 27.2% |
| Part Time | 7.4% | 7.0% | 6.3% | 7.7% |
| Total | 17.5% | 18.1% | 19.3% | 22.2% |
The percentage of Non-Christian students had increased year on year.

| 2021/2022 | 2022/2023 | 2023/2024 | 2024/2025 | |
|---|---|---|---|---|
| Christian | 5,615 | 6,940 | 6,400 | 4,020 |
| Non-Christian | 3,455 | 4,020 | 4,355 | 3,680 |
| No Religion | 6,380 | 6,350 | 6,025 | 5,335 |
| Info Refused/Blank | 390 | 485 | 515 | 490 |
| Total | 15,845 | 17,790 | 17,290 | 13,545 |
No Religion overtook Christian to be the largest proportion of full-time enrolments in 2024/25.
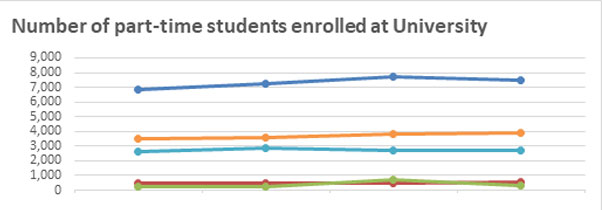
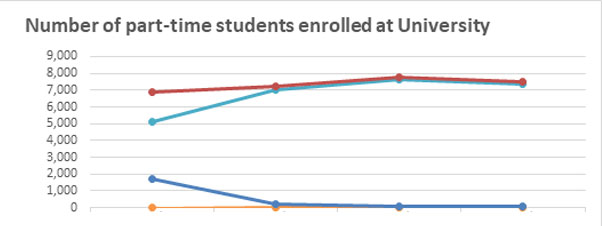
| 2021/2022 | 2022/2023 | 2023/2024 | 2024/2025 | |
|---|---|---|---|---|
| Christian | 2,630 | 2,905 | 2,690 | 2,695 |
| Non-Christian | 505 | 505 | 490 | 575 |
| No Religion | 3,470 | 3,585 | 3,840 | 3,390 |
| Info Refused/Blank | 245 | 260 | 740 | 350 |
| Total | 6,855 | 7,255 | 7,760 | 7,510 |
No Religion remains the highest category for part-time students in the past few years.
Benchmark comparison: there is no available benchmarking data for 2025, benchmarking is based on 2024 data.
Source: HESA
| Religion | Full Time | Part Time | Total | Full Time | Part Time | Total |
|---|---|---|---|---|---|---|
| Teesside University | National Data | |||||
| 2023/24 | 2023/24 | |||||
| No Religion | 6,025 | 3,840 | 9,865 | 926,345 | 209,735 | 1,136,080 |
| Buddhist | 155 | 45 | 195 | 29,210 | 4,060 | 33,270 |
| Christian | 6,040 | 2,690 | 9,090 | 609,340 | 159,880 | 769,220 |
| Hindu | 1,800 | 60 | 1,860 | 140,080 | 10,025 | 150,105 |
| Jewish | 5 | 5 | 10 | 9,425 | 19,50 | 11,370 |
| Muslim | 2,145 | 260 | 2,405 | 311,785 | 33,185 | 345,370 |
| Pagan | 545 | 150 | 695 | |||
| Sikh | 45 | 15 | 60 | 34,260 | 3,260 | 37,520 |
| Any other religion or belief | 210 | 110 | 320 | 54,095 | 17,845 | 71,935 |
| Not known | 515 | 740 | 1,250 | 222,520 | 126,335 | 348,855 |
| Non-Christian | 4,130 | 490 | 4,620 | 579,400 | 70,875 | 650,265 |
| % Christian | 37.0% | 34.7% | 36.3% | 26.1% | 28.2% | 26.5% |
| % Non-Christian | 25.2% | 6.4% | 19.4% | 24.8% | 12.5% | 22.4% |
| % No Religion | 34.8% | 49.5% | 39.4% | 39.6% | 37.0% | 39.1% |
Sexual orientation
This report gives information regarding the sexual orientation of students at Teesside University. Each section details the comparisons between total students and those classed as Heterosexual and Non-Heterosexual (details below).
Students have been grouped into one of seven groups:
- Heterosexual
- Bisexual
- Gay Man
- Gay Woman/Lesbian
- Gay or Lesbian
- Information Refused/Blank
- Other
These are then grouped into three groups Heterosexual, Non-Heterosexual and Information Refused.
Change 23/24 to 24/25 identifies the change in the measure between the two years. Difference from overall identifies the difference in the measure compared to the overall student population.
| Measure | 2023/24 | 2024/25 | Change 23/24 to 24/25 | 2023/24 | 2024/25 | Change 23/24 to 24/25 | Diff from overall | 2023/24 | 2024/25 | Change 23/24 to 24/25 | Diff from overall |
|---|---|---|---|---|---|---|---|---|---|---|---|
| Overall | Heterosexual | Non-Heterosexual | |||||||||
| Full Time Enrolments | 17,290 | 13,545 | -21.7% | 13,855 | 10,590 | -23.6% | -1.9% | 1,600 | 1,355 | -15.4% | +6.2% |
| Part Time Enrolments | 7,760 | 7,510 | -3.2% | 6,815 | 6,530 | -4.2% | -1.0% | 480 | 490 | +1.5% | +4.7% |
| Progression - % Pass/Proceed | 85.3% (7,600/8,910) |
85.7% (6,190/7,225) |
83.2% (905/1,085) |
||||||||
| Good Honours | 73.4% (1,975/2,690) |
73.9% (1,645/2,225) |
71.2% (230/325) |
||||||||
| UCAS Tariff (FT, Degree, Home)* | 113 | 112 | 115 | ||||||||
| Graduate Outcomes (FT, Degree, Home)** | 79.2% (870/1,100) |
80.3% (765/955) |
76.1% (85/115) |
||||||||
* Based on Young students (aged under 21) so any students above this age are not included in analysis.
** Based on 2021/22 Graduate Outcomes surveys.
| Measure | 2023/24 | 2024/25 | Change 23/24 to 24/25 | 2023/24 | 2024/25 | Change 23/24 to 24/25 | Diff from overall |
|---|---|---|---|---|---|---|---|
| Overall | Information Refused / Blank | ||||||
| Full Time Enrolments | 17,290 | 13,545 | -21.7% | 1,830 | 1,595 | -12.8% | +8.8% |
| Part Time Enrolments | 7,760 | 7,510 | -3.2% | 465 | 490 | +6.0% | +9.3% |
| Progression - % Pass/Proceed | 85.3% (7,600/8,910) |
84.5% (505/600) |
|||||
| Good Honours | 73.4% (1,975/2,690) |
70.9% (100/140) |
|||||
| UCAS Tariff (FT, Degree, Home)* | 113 | 119 | |||||
| Graduate Outcomes (FT, Degree, Home)** | 79.2% (870/1,100) |
56.3% (20/30) |
|||||
* Based on students aged under 21, so any students above this age are not included in analysis.
** Based on 2021/22 Graduate Outcomes surveys.
| Measure | Heterosexual | Non-Heterosexual | Bisexual | Gay Man | Gay Woman/Lesbian | Gay or Lesbian | Other | ||||||
|---|---|---|---|---|---|---|---|---|---|---|---|---|---|
| Diff from overall | Diff from overall | Diff from Hetero-sexual | Diff from overall | Diff from Hetero-sexual | Diff from overall | Diff from Hetero-sexual | Diff from overall | Diff from Hetero-sexual | Diff from overall | Diff from Hetero-sexual | Diff from overall | Diff from Hetero-sexual | |
| Full Time Enrolments | -1.9% | +6.2% | +8.1% | +10.2% | +12.1% | +9.3% | +11.2% | -13.3% | -11.4% | ||||
| Part Time Enrolments | -1.0% | +4.7% | +5.6% | +3.2% | +4.2% | +2.7% | +3.7% | +20.6% | +21.6% | ||||
| Progression - % Pass/Proceed | |||||||||||||
| Good Honours | |||||||||||||
| UCAS Tariff (FT, Degree, Home)* | |||||||||||||
| Graduate Outcomes (FT, Degree, Home)** | |||||||||||||
2024/25 enrolled students (all years, all modes)
| Sexual Orientation | Full time | Part time | Total | Full time | Part time | Total | Full time | Part time | Total |
|---|---|---|---|---|---|---|---|---|---|
| 2022/23 | 2023/24 | 2024/25 | |||||||
| Heterosexual | 14,620 | 6,245 | 20,870 | 13,855 | 6,815 | 20,670 | 10,590 | 6,530 | 17,120 |
| Bisexual | 980 | 220 | 1,200 | 970 | 225 | 1,195 | 860 | 225 | 1,085 |
| Gay man | |||||||||
| Gay Woman/ Lesbian | <5 | <5 | |||||||
| Gay or Lesbian | 370 | 215 | 585 | 365 | 210 | 575 | 320 | 210 | 530 |
| Other | 290 | 50 | 340 | 265 | 45 | 310 | 175 | 55 | 225 |
| Info Refused/ Blank | 1,525 | 525 | 2,050 | 1,830 | 465 | 2,295 | 1,595 | 490 | 2,090 |
| Total | 17,790 | 7,255 | 25,045 | 17,290 | 7,760 | 25,045 | 13,545 | 7,510 | 21,050 |
| Non-Heterosexual | 1,645 | 485 | 2,130 | 1,600 | 480 | 2,085 | 1,355 | 490 | 1,845 |
| % Heterosexual | 82.2% | 86.1% | 83.3% | 80.1% | 87.8% | 82.5% | 78.2% | 86.9% | 81.3% |
| % Non-Heterosexual | 9.2% | 6.7% | 8.5% | 9.3% | 6.2% | 8.3% | 10.0% | 6.5% | 8.8% |

| 2021/2022 | 2022/2023 | 2023/2024 | 2024/2025 | |
|---|---|---|---|---|
| Full Time | 10.6% | 9.2% | 9.3% | 10.0% |
| Part Time | 4.5% | 6.7% | 6.2% | 6.5% |
| Total | 8.8% | 8.5% | 8.3% | 8.8% |
The proportion of Non-Heterosexual students increased slightly by 0.5% in 2024/25 after seeing a decline for past few years.
| 2021/2022 | 2022/2023 | 2023/2024 | 2024/2025 | |
|---|---|---|---|---|
| Heterosexual | 13,025 | 14,620 | 13,855 | 10,590 |
| Non-Heterosexual | 1,680 | 1,645 | 1,600 | 1,355 |
| Info Refused/Blank | 1,135 | 1,525 | 1,830 | 1,595 |
| Total | 15,845 | 17,790 | 17,290 | 13,545 |
The proportion of full time Non-Heterosexual students has seen small rises since 2022/23.

| 2021/2022 | 2022/2023 | 2023/2024 | 2024/2025 | |
|---|---|---|---|---|
| Heterosexual | 4,890 | 6,245 | 6,815 | 6.530 |
| Non-Heterosexual | 310 | 485 | 480 | 490 |
| Info Refused/Blank | 1,655 | 525 | 465 | 490 |
| Total | 6,855 | 7,255 | 7,760 | 7,510 |