Staff Data Analysis
The staff data analysis is informed by a snapshot of data as of July 2023.
The total number of staff employed at the University for 2023 is 2,246 FTE .Academic staff account for 36% of the total, support staff account for 61% and 3% account for senior management.

Gender
The University employs more female staff than male staff; a split 59.5% to 40.5%. The Gender Pay Gap 2022 Report illustrates the four quartile pay bands:
- upper quartile was 48%/ 52% female/male
- upper middle quartile 50%/50% female/male
- lower middle quartile 60%/40% female/male
- lower quartile 76%/24% female/male.
2021
1147
59.8%
771
40.2%
2022
1217
59.3%
834
40.7%
2023
1336
59.5%
910
40.5%
2023 : Senior Management
48.6% Male / 51.4% Female
2023 : Academic
50.6% Male / 49.4% Female
2023 : Support
34.2% Male / 65.8% Female
Benchmark Comparison
Source: Advancehe.ac.uk
Survey: Equality in higher education: staff statistical report 2022
| Academic staff | Benchmark | 2021 | 2022 | 2023 | |||
|---|---|---|---|---|---|---|---|
| Male | 53.00% | 51.8% | 51.6% | 50.9% | |||
| Female | 47.00% | 48.2% | 48.4% | 49.1% | |||
| Professional and support staff | Benchmark | 2021 | 2022 | 2023 | |||
|---|---|---|---|---|---|---|---|
| Male | 37.50% | 34.9% | 35.4% | 35.5% | |||
| Female | 62.50% | 65.1% | 64.6% | 64.5% | |||
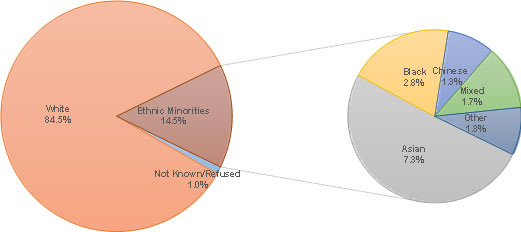
Ethnicity
Staff stating white ethnicity has increased by 147 positions from 1750 in 2022 to 1897 in 2023. Staff declaring themselves as in an ethnic minority has increased by 40 positions from 286 in 2022 to 326 in 2023. Staff with an unknown ethnicity has increased by 8 positions from 15 in 2022 to 23 in 2023.
The percentage of staff from ethnic minority backgrounds has increased. There has been a year-on-year increase since 2015 from 6.33% to 14.5% in 2023. It is worth noting that Teesside University's ethnic minority staff profile is significantly above the 2021 Census for the North East for people from ethnic minority backgrounds was at 6.9%.
Of those staff who identify as other than white British, 7.3% are Asian, and 1.3% of our ethnic minority staff identify as Chinese. The percentage of black staff stands at 2.8% - an increase of 1.7% since 2021, whilst the percentages for 'other' at 1.3% has seen a small decrease The number of staff from ethnic minority backgrounds is below the HE sector benchmark of 16.3%.
| 2021 | 2022 | 2023 | |
|---|---|---|---|
| Not Known/Refused | 0.4% | 0.7% | 1.0% |
| White | 87.7% | 85.3% | 84.5% |
| Asian | 5.8% | 7.0% | 7.3% |
| Black | 1.1% | 2.1% | 2.8% |
| Chinese | 1.5% | 1.5% | 1.3% |
| Mixed | 2.2% | 1.9% | 1.7% |
| Other | 1.2% | 1.5% | 1.3% |
The groupings for ethnicity have been taken from the ONS guidance.
Ethnicity Groupings:
Asian - Asian or Asian British: Bangladeshi, Asian or Asian British: Indian, Asian or Asian British: Pakistani, and other Asian background. Black - black or black British: African, black or black British: Caribbean, and other black background. Chinese. Mixed Other ethnic background. White - all white ethnic groups including white British.
Staff stating white ethnicity has increased by 147 positions from 1,750 in 2022 to 1,897 in 2023. Staff declaring themselves as in an ethnic minority has increased by 40 positions from 286 in 2022 to 326 in 2023. Staff with an unknown ethnicity has increased by 8 positions from 15 in 2022 to 23 in 2023.
Benchmark Comparison
Source: Advancehe.ac.uk
Survey: Equality in higher education: staff statistical report 2022
| Benchmark | 2021 | 2022 | 2023 | ||||
|---|---|---|---|---|---|---|---|
| White | 83.70% | 87.7% | 85.3% | 84.5% | |||
| Ethnic minorities | 16.30% | 11.9% | 13.9% | 14.5% | |||
Note: Not known/refused University staff are not included in the benchmark comparison table, therefore totals may not add up to 100%. Ethnic minorities comprises Asian, black, Chinese, mixed and other.
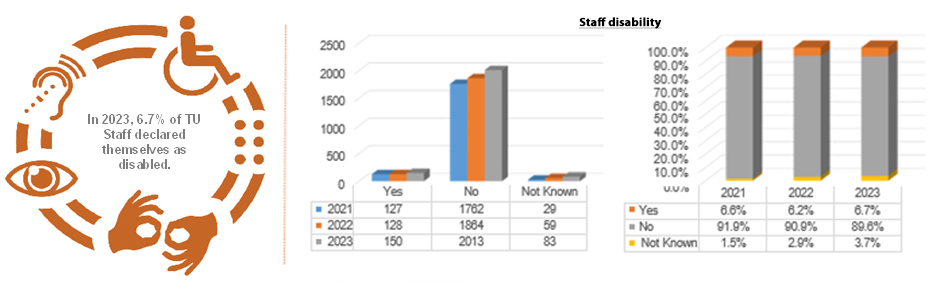
Disability
There was an increase in the number of staff declaring a disability in 2023. 6..7% of University staff declared themselves disabled. Teesside has a slightly higher proportion of disabled staff than the HE sector benchmark at 6%.
Benchmark Comparison
Source: Advancehe.ac.uk
Survey: Equality in higher education: staff statistical report 2022
| Benchmark | 2021 | 2022 | 2023 | ||||
|---|---|---|---|---|---|---|---|
| All disabled staff | 6.00% | 6.6% | 6.2% | 6.7% | |||
| All non-disabled staff * | 94.00% | 93.4% | 93.8% | 93.3% | |||
*For the purposes of benchmarking, all TU "Not Known" staff have been classified as 'non-disabled'.
Sexual Orientation
Staff stating heterosexual as their sexual orientation has increased by 192 positions from 1,522 in 2022 to 1,714 in 2023. Staff declaring themselves as non-heterosexual has increased by 21 positions from 113 in 2022 to 134 in 2023. Staff not declaring their sexual orientation has reduced by 18 positions from 416 in 2022 to 398 in 2023.
In 2023, 6% of Teesside University staff declared themselves as non-heterosexual. The current benchmark figure for this stands at 3.7%. The University will continue to encourage existing staff to update their information as part of the annual records check.
Heterosexual Non-heterosexual Not Known/Refused
Benchmark Comparison
Source: Advancehe.ac.uk
Survey: Equality in higher education: staff statistical report 2022
| Benchmark | 2021 | 2022 | 2023 | ||||
|---|---|---|---|---|---|---|---|
| Bisexual | 1.30% | 2.0% | 2.1% | 2.7% | |||
| Gay man | 1.30% | 1.2% | 1.4% | 1.6% | |||
| Gay woman/lesbian | 0.70% | 1.6% | 1.4% | 1.2% | |||
| Heterosexual | 45.80% | 72.8% | 74.2% | 76.3% | |||
| Other | 0.40% | 0.4% | 0.5% | 0.5% | |||
| Information refused | 7.50% | 4.6% | 5.3% | 5.3% | |||
| Not known | 43.00% | 17.3% | 15.0% | 12.5% | |||
The University Not Known is 12.5% for 2023 which is substantially below the benchmark for the sector, which is 43%.
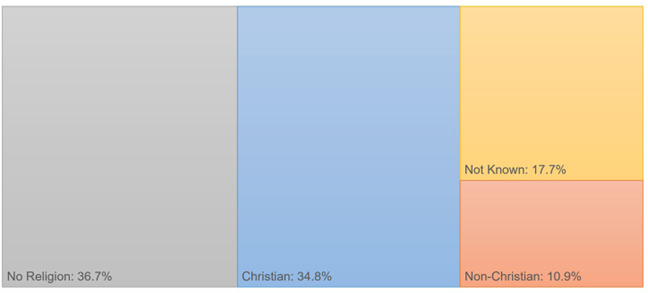
Religion and Belief
Staff stating Christian as their religion has increased by 82 positions from 699 in 2022 to 781 in 2023. Staff declaring themselves as non-Christian has increased by 29 positions from 215 in 2022 to 244 in 2023. Staff stating no religion has increased by 106 positions from 718 in 2022 to 824 in 2023. Staff with an unknown religion has reduced by 22 positions from 419 in 2022 to 397 in 2023, which is considerably below the benchmark.
Benchmark Comparison
Source: Advancehe.ac.uk
Survey: Equality in higher education: staff statistical report 2022
| Benchmark | 2021 | 2022 | 2023 | ||||
|---|---|---|---|---|---|---|---|
| No religion | 25.00% | 35.2% | 35.0% | 36.7% | |||
| Buddhist | 0.50% | 0.4% | 0.5% | 0.5% | |||
| Christian | 17.70% | 33.0% | 34.1% | 34.8% | |||
| Hindu | 1.00% | 0.8% | 1.2% | 1.4% | |||
| Jewish | 0.30% | 0.1% | 0.0% | 0.0% | |||
| Muslim | 1.90% | 4.5% | 5.3% | 5.3% | |||
| Sikh | 0.30% | 0.3% | 0.3% | 0.3% | |||
| Spiritual | 0.60% | 1.9% | 1.6% | 0.0% | |||
| Any other religion or belief | 1.50% | 1.7% | 1.6% | 3.4% | |||
| Information refused | 7.20% | 4.7% | 5.3% | 5.2% | |||
| Not known | 44.00% | 17.6% | 15.2% | 12.5% | |||
The University Not Known is 12.5% for 2023,which is substantially below the benchmark for the sector, which is 44%.
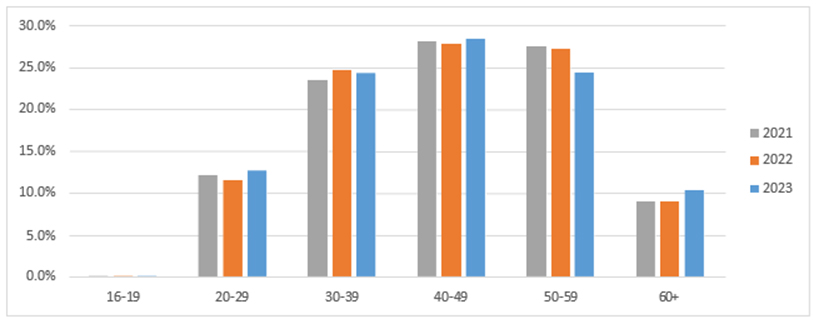
Age
There has been a change to the University's age profile since 2020. The 40 - 49 age group now represent the largest of our staff population compared to 50 - 59 in 2020. 35% of staff are aged 50 years or over which has significant implications for workforce planning at the University. The University continues to encourage applications from younger people and to develop apprentice.