Student data analysis
The data presented includes a range of information broken down for each protected characteristics as of August 2023.
The data highlights changes in numbers of students with a given characteristic over the years and the proportion of students with a given characteristic against the total University student population.

The data covers the characteristics of age, disability, race, gender, religion and belief, sexual orientation and gender identify.
Age
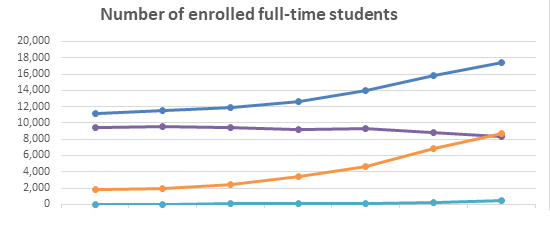
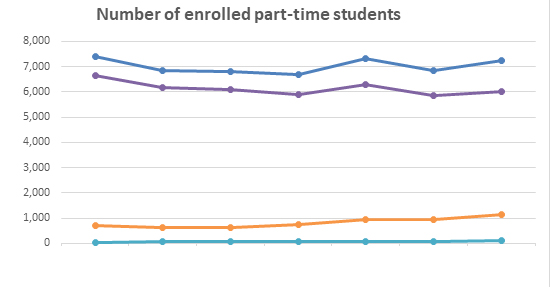
2022/23 enrolled students (all years, all modes)
| Age group | Full time | Part time | Total | Full time | Part time | Total | Full time | Part time | Total |
|---|---|---|---|---|---|---|---|---|---|
| 2020/21 | 2021/22 | 2022/23 | |||||||
| Under 21 | 5,495 | 783 | 6,278 | 4,785 | 646 | 5,431 | 4,656 | 568 | 5,224 |
| 21 - 24 | 3,420 | 1,042 | 4,462 | 3,737 | 870 | 4,607 | 3,898 | 839 | 4,737 |
| 25 - 49 | 4,873 | 4,891 | 9,764 | 7,149 | 4,674 | 11,823 | 8,689 | 5,145 | 13,834 |
| Over 50 | 178 | 594 | 772 | 173 | 663 | 836 | 186 | 710 | 896 |
| Total | 13,966 | 7,310 | 21,276 | 15,844 | 6,853 | 22,697 | 17,429 | 7,262 | 24,691 |
| Over 25 | 5,051 | 5,485 | 10,536 | 7,322 | 5,337 | 12,659 | 8,875 | 5,855 | 14,730 |
| % over 25 | 36.2% | 75.0% | 49.5% | 46.2% | 77.9% | 55.8% | 50.9% | 80.6% | 59.7% |
* Analysis is based on the student's age on entry to their course.
There has been a decrease of 207 students under the age of 21. Other age groups have seen increases.
| 2016/2017 | 2017/2018 | 2018/2019 | 2019/2020 | 2020/2021 | 2021/2022 | 2022/2023 | |
|---|---|---|---|---|---|---|---|
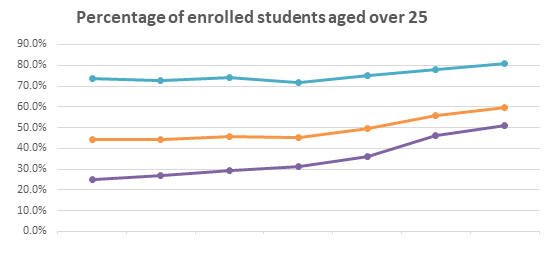
| Full Time | 24.9% | 27.1% | 29.3% | 31.4% | 36.2% | 46.2% | 50.9% |
| Part Time | 73.4% | 72.5% | 74.0% | 71.5% | 75.0% | 77.9% | 80.6% |
| Total | 44.3% | 44.0% | 45.6% | 45.2% | 49.5% | 55.8% | 59.7% |
The percentage of students aged 25 and above have increased to its highest percentage over the last few years in both modes of study.
| 2016/2017 | 2017/2018 | 2018/2019 | 2019/2020 | 2020/2021 | 2021/2022 | 2022/2023 | |
|---|---|---|---|---|---|---|---|
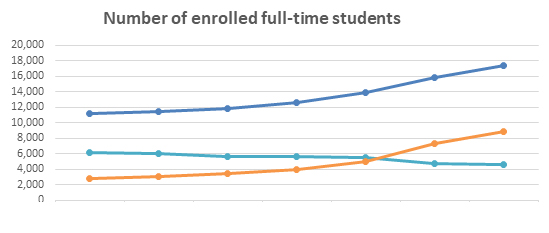
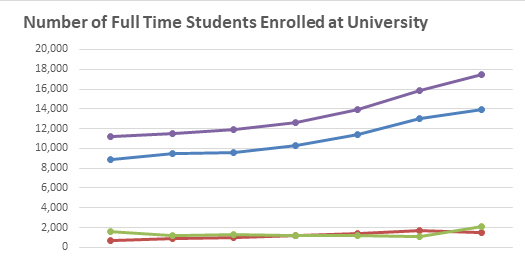
| Under 21 | 6,142 | 6,092 | 5,610 | 5,668 | 5,495 | 4,785 | 4,656 |
| Over 25 | 2,781 | 3,124 | 3,483 | 3,956 | 5,051 | 7,322 | 8,875 |
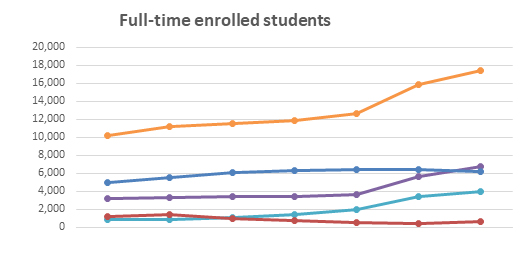
| Total | 11,152 | 11,523 | 11,876 | 12,615 | 13,966 | 15,844 | 17,429 |
Students over 25 are at their highest level over the past few years with a 6,094 headcount increase from 2016/17 to 2022/23.
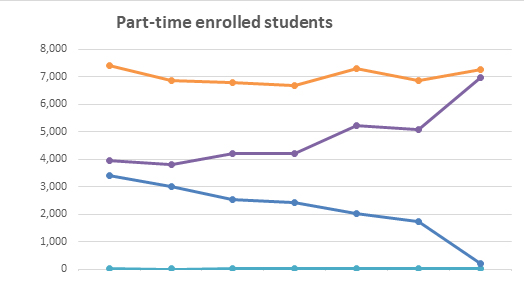
| 2016/2017 | 2017/2018 | 2018/2019 | 2019/2020 | 2020/2021 | 2021/2022 | 2022/2023 | |
|---|---|---|---|---|---|---|---|
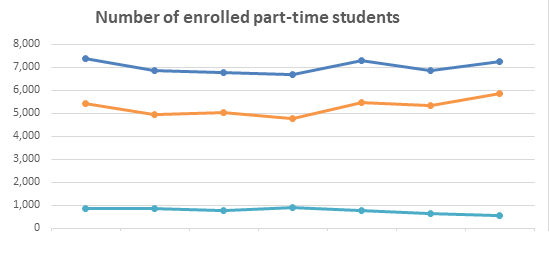
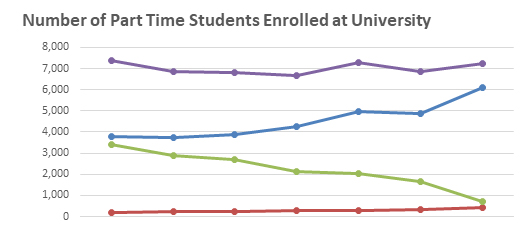
| Under 21 | 877 | 848 | 764 | 891 | 783 | 646 | 568 |
| Over 25 | 5,435 | 4,966 | 5,028 | 4,772 | 5,485 | 5,337 | 5,585 |
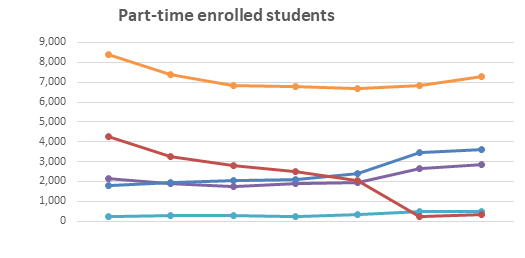
| Total | 7,402 | 6,854 | 6,791 | 6,577 | 7,310 | 6,853 | 7,262 |
Part-time students over 25 have decreased slightly by 148 between 2020/21 and 202/22 before a greater rise of 518 in 2022/23. Under 21s have continued to decrease gradually since 2019/20.
Disability
The tables below present information regarding disabled students at Teesside University. Each section details the comparisons between total students as well as those who have either declared a disability in their student record or those in receipt of a Disabled Students' Allowance.
2022/23 enrolled students (all years, all modes)
| Disability | Full time | Part time | Total | Full time | Part time | Total | Full time | Part time | Total |
|---|---|---|---|---|---|---|---|---|---|
| 2020/21 | 2021/22 | 2022/23 | |||||||
| Specific learning difficulty | 760 | 295 | 1,055 | 743 | 301 | 1,044 | 623 | 341 | 964 |
| Physical impairment or mobility issue | 64 | 33 | 97 | 46 | 25 | 71 | 41 | 18 | 59 |
| Long standing illness | 236 | 102 | 338 | 194 | 103 | 297 | 188 | 98 | 286 |
| Disability not listed above | 122 | 40 | 162 | 152 | 44 | 196 | 136 | 40 | 176 |
| Deaf or hearing impaired | 45 | 16 | 61 | 38 | 24 | 62 | 32 | 25 | 57 |
| Blind or visually impaired | 16 | 5 | 21 | 18 | 7 | 25 | 17 | 14 | 31 |
| Multiple disabilities | 285 | 99 | 384 | 474 | 125 | 599 | 544 | 218 | 762 |
| Mental health condition | 720 | 197 | 917 | 759 | 201 | 960 | 696 | 211 | 907 |
| Social/communication impairment | 156 | 25 | 181 | 153 | 32 | 185 | 149 | 24 | 173 |
| Development condition since childhood | 4 | 4 | |||||||
| Total disabled | 2,404 | 812 | 3,216 | 2,577 | 862 | 3,439 | 2,430 | 989 | 3,419 |
| Not known disability | 11,562 | 6,498 | 18,060 | 13,267 | 5,991 | 19,258 | 14,999 | 6,273 | 21,272 |
| Total | 13,966 | 7,310 | 21,276 | 15,844 | 6,853 | 22,697 | 17,429 | 7,262 | 24,691 |
| % declaring disability | 17.2% | 11.1% | 15.1% | 16.3% | 12.6% | 15.2% | 13.9% | 13.6% | 13.8% |
There has been a slight decrease in the total number of disabled students from 21/22 to 22/23. The number of students who have declared a disability has also decreased by 1.4% from 21/22 to 22/23.
Students who are receiving Disabled Students' Allowance (DSA)
| 2020/2021 | 2021/2022 | 2022/2023 | ||||
|---|---|---|---|---|---|---|
| Full-time students | 1,053 | 7.5% | 917 | 5.8% | 762 | 4.4% |
| Part-time students | 195 | 2.7% | 144 | 2.1% | 118 | 1.6% |
There has been a decrease in full time students by 1.4% and part time students by 0.5% who are receiving DSA.
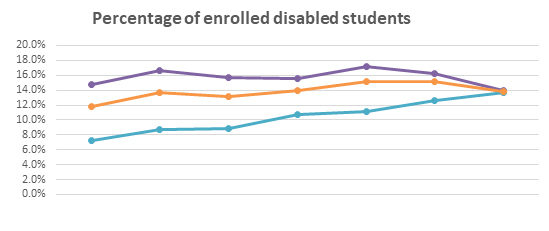
| 2016/2017 | 2017/2018 | 2018/2019 | 2019/2020 | 2020/2021 | 2021/2022 | 2022/2023 | |
|---|---|---|---|---|---|---|---|
| Full Time | 14.7% | 16.6% | 15.7% | 15.6% | 17.2% | 16.3% | 13.9% |
| Part Time | 7.3% | 8.7% | 8.8% | 10.7% | 11.1% | 12.6% | 13.6% |
| Total | 11.7% | 13.6% | 13.2% | 13.9% | 15.1% | 15.2% | 13.8% |
The percentage of part-time disabled students has increased year on year between 2020/21 and 2022/23, full-time disable students have reduced during the same period.
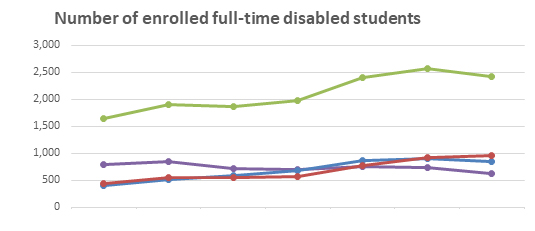
| 2016/2017 | 2017/2018 | 2018/2019 | 2019/2020 | 2020/2021 | 2021/2022 | 2022/2023 | |
|---|---|---|---|---|---|---|---|
| DSLD | 901 | 846 | 728 | 705 | 760 | 743 | 623 |
| MHC & ASC | 396 | 520 | 582 | 691 | 876 | 912 | 845 |
| Other Disability | 444 | 548 | 554 | 575 | 768 | 922 | 962 |
| Total Disability | 1,641 | 1,914 | 1,864 | 1,971 | 2,404 | 2,577 | 2,430 |
The number of full-time students who have declared a mental health or social/communication disability (MHC & ASC) and specific learning difficulty (DSLD) have decreased since last year. There has been increase in the other disability category since 2016/17.
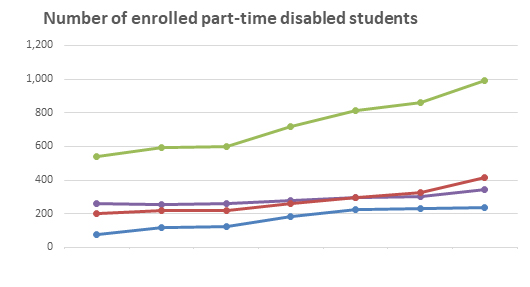
| 2016/2017 | 2017/2018 | 2018/2019 | 2019/2020 | 2020/2021 | 2021/2022 | 2022/2023 | |
|---|---|---|---|---|---|---|---|
| DSLD | 261 | 254 | 261 | 276 | 295 | 301 | 341 |
| MHC & ASC | 76 | 118 | 122 | 182 | 222 | 233 | 235 |
| Other Disability | 201 | 221 | 216 | 259 | 295 | 328 | 413 |
| Total Disability | 538 | 593 | 599 | 717 | 812 | 862 | 989 |
A higher proportion of part-time students have declared they have either a specific learning disability or other disability, with over 300 students under each category. The number of part-time disabled students has seen increases year on year overall since 2016/17 with 5.8 compared to 989 in 2022/23.
Benchmark Comparison
Source:HESA
| Disability | Benchmark | 2022 |
|---|---|---|
| Known disability | 16.0% | 15.2% |
*There is no available benchmarking data for 2023, benchmarking is based on 2022 data.
Ethnic origin
The tables below include a range of information regarding the ethnic origin of students at Teesside University. Each section details the comparisons between total students and those classed as non-white.
Students have been grouped into one of six groups:
- Asian
- Black
- Chinese
- Not Known
- Other
- White
These are then grouped into three groups: white, non-white and not known.
2022/23 enrolled students (all years, all modes)
| Ethnic group | Full time | Part time | Total | Full time | Part time | Total | Full time | Part time | Total |
|---|---|---|---|---|---|---|---|---|---|
| 2020/21 | 2021/22 | 2022/23 | |||||||
| White | 9,294 | 6,288 | 15,582 | 8,823 | 5,863 | 14,686 | 8,289 | 6,025 | 14,314 |
| Other | 418 | 231 | 649 | 384 | 203 | 587 | 460 | 228 | 688 |
| Asian | 2,769 | 397 | 3,166 | 3,742 | 377 | 4,119 | 3,882 | 420 | 4,302 |
| Black | 1,026 | 275 | 1,301 | 2,378 | 297 | 2,675 | 4,036 | 444 | 4,480 |
| Chinese | 392 | 52 | 444 | 307 | 52 | 359 | 293 | 50 | 343 |
| Not Known | 67 | 67 | 134 | 210 | 61 | 271 | 469 | 95 | 564 |
| Total | 13,966 | 7,310 | 21,276 | 15,844 | 6,853 | 22,697 | 17,429 | 7,262 | 24,691 |
| Non-white | 4,605 | 955 | 5,560 | 6,811 | 929 | 7,740 | 8,671 | 1142 | 9,813 |
| % White | 66.5% | 86.0% | 73.2% | 55.7% | 85.6% | 64.7% | 47.6% | 83.0% | 58.0% |
| % Non-white | 33.0% | 13.1% | 26.1% | 43.0% | 13.6% | 34.1% | 49.8% | 15.7% | 39.7% |
| % Not known | 0.5% | 0.9% | 0.6% | 1.3% | 0.9% | 1.2% | 2.7% | 1.3% | 2.3% |
There has been a substantial increase in the number of black students by 1,805 from 2021/22 to 2022/23. The number of white students has reduced by 372 since 2021/22.
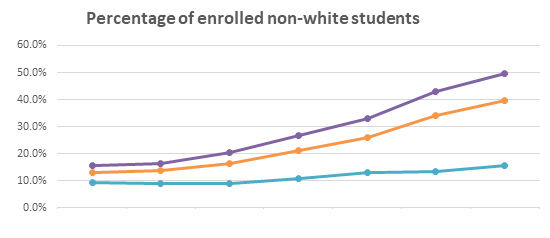
| 2016/2017 | 2017/2018 | 2018/2019 | 2019/2020 | 2020/2021 | 2021/2022 | 2022/2023 | |
|---|---|---|---|---|---|---|---|
| Full Time | 15.8% | 16.5% | 20.5% | 26.9% | 33.0% | 43.0% | 49.8% |
| Part Time | 9.3% | 8.9% | 9.1% | 10.9% | 13.1% | 13.6% | 15.7% |
| Total | 13.2% | 13.7% | 16.3% | 21.4% | 26.1% | 34.1% | 39.7% |
There has been an 26.5% increase in the total percentage of non-white students from 2016/17 (13.2%) to 2021/22 (39.7%).
| 2016/2017 | 2017/2018 | 2018/2019 | 2019/2020 | 2020/2021 | 2021/2022 | 2022/2023 | |
|---|---|---|---|---|---|---|---|
| White | 9,372 | 9,584 | 9,392 | 9,169 | 9,294 | 8,823 | 8,289 |
| Not Known | 17 | 33 | 52 | 57 | 67 | 210 | 469 |
| Non-White | 1,763 | 1,906 | 2,432 | 3,389 | 4,605 | 6,811 | 8,671 |
| Total | 11,152 | 11,523 | 11,876 | 12,615 | 13,966 | 15,844 | 17,429 |
There has been a significant increase of 6,908 non-white students since 2016/17 with an increase of 1,860 in 2022/23 alone.
| 2016/2017 | 2017/2018 | 2018/2019 | 2019/2020 | 2020/2021 | 2021/2022 | 2022/2023 | |
|---|---|---|---|---|---|---|---|
| White | 6,670 | 6,181 | 6,102 | 5,879 | 6,282 | 5,863 | 6,025 |
| Not Known | 44 | 63 | 71 | 68 | 67 | 61 | 95 |
| Non-White | 688 | 610 | 618 | 730 | 955 | 929 | 1142 |
| Total | 7,402 | 6,854 | 6,791 | 6,677 | 7,310 | 6,853 | 7,262 |
There has been a reduction from 2016/17 (6,670) to 2019/20 (6,025) of white students. There has been an increase in 2020/21 to 6,288, however numbers are below 2016/17 levels and have decreased again in 2021/22 to the lowest in recent years. Non-white students have seen increases since 2017/18 with a slight decrease in 2021/22.
Benchmark Comparison
Source:HESA
| Ethnic origin | Benchmark | 2022 |
|---|---|---|
| White | 73.0% | 64.7% |
| Non white | 27.0% | 34.1% |
*There is no available benchmarking data for 2023, benchmarking is based on 2022 data.
Gender identity
The table below gives information regarding the gender identity of students at Teesside University. Each section details the comparisons between total students who have the same gender as they were born with.
Students have been grouped into one of three bands:
- Yes, their gender is the same
- No, their gender has changed
- Information refused/blank.
2022/23 enrolled students (all years, all modes)
| Gender ID | Full time | Part time | Total | Full time | Part time | Total | Full time | Part time | Total |
|---|---|---|---|---|---|---|---|---|---|
| 2020/21 | 2021/22 | 2022/23 | |||||||
| Yes | 13,353 | 5,233 | 18,586 | 15,257 | 5,091 | 20,348 | 17,015 | 6,992 | 24,007 |
| No | 158 | 31 | 189 | 154 | 30 | 184 | 143 | 45 | 188 |
| Information refused/blank | 455 | 2,046 | 2,501 | 433 | 1,732 | 2,165 | 271 | 225 | 496 |
| Total | 13,966 | 7,310 | 21,276 | 15,844 | 6,853 | 22,697 | 17,429 | 7,262 | 24,691 |
| % Yes | 95.6% | 71.6% | 87.4% | 96.3% | 74.3% | 89.7% | 97.6% | 96.3% | 97.2% |
| % No | 1.1% | 0.4% | 0.9% | 1.0% | 0.4% | 0.8% | 0.8% | 0.6% | 0.8% |
| % Information refused/blank | 3.3% | 28.0% | 11.8% | 2.7% | 25.3% | 9.5% | 1.6% | 3.1% | 2.0% |
The number of students that answered no has increased slightly by 4 from 2021/22 to 2022/23. There has been a huge decrease in the number of students that refused/blank by 1,669.
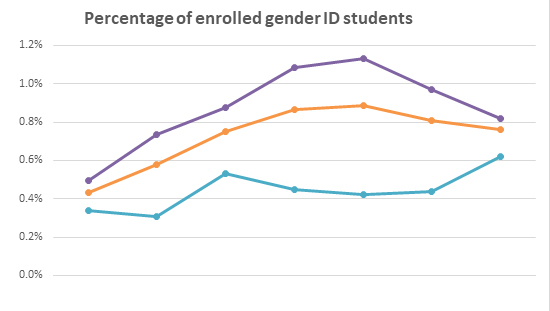
| 2016/2017 | 2017/2018 | 2018/2019 | 2019/2020 | 2020/2021 | 2021/2022 | 2022/2023 | |
|---|---|---|---|---|---|---|---|
| Full Time | 0.5% | 0.7% | 0.9% | 1.1% | 1.1% | 1.0% | 0.8% |
| Part Time | 0.3% | 0.3% | 0.5% | 0.4% | 0.4% | 0.4% | 0.6% |
| Total | 0.4% | 0.6% | 0.7% | 0.9% | 0.9% | 0.8% | 0.8% |
There has been no overall change between 2021/22 and 2022/23 for no to Gender ID which remains at 0.8% at one decimal place (increase in part-time, decrease for full-time).
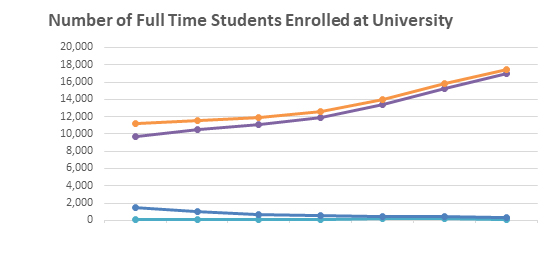
| 2016/2017 | 2017/2018 | 2018/2019 | 2019/2020 | 2020/2021 | 2021/2022 | 2022/2023 | |
|---|---|---|---|---|---|---|---|
| Yes | 9,661 | 10,452 | 11,071 | 11,910 | 13,353 | 15,257 | 17,015 |
| No | 55 | 85 | 104 | 137 | 158 | 154 | 143 |
| Info Refused/Blank | 1,436 | 986 | 701 | 568 | 455 | 433 | 271 |
| Total | 11,152 | 11,523 | 11,876 | 12,615 | 13,966 | 15,844 | 17,429 |
The information refused number has continued to reduce, accounting for 1.6% full-time population. The percentage who responded no account for 0.8% of the population.
| 2016/2017 | 2017/2018 | 2018/2019 | 2019/2020 | 2020/2021 | 2021/2022 | 2022/2023 | |
|---|---|---|---|---|---|---|---|
| Yes | 3,947 | 3,820 | 4,209 | 4,210 | 5,233 | 5,091 | 6,992 |
| No | 25 | 21 | 36 | 30 | 31 | 30 | 45 |
| Info Refused/Blank | 3,430 | 3,013 | 2,546 | 2,437 | 2,046 | 1,732 | 225 |
| Total | 7,402 | 6,854 | 6,791 | 6,677 | 7,310 | 6,853 | 7,262 |
The number of students who responded no has increased by 15 from last year. Information refused has decreased by 1,507.
Gender
The tables below details gender information of students at Teesside University, including the comparisons between total students and those who are female or male.
2022/23 enrolled students (all years, all modes)
| Gender | Full time | Part time | Total | Full time | Part time | Total | Full time | Part time | Total |
|---|---|---|---|---|---|---|---|---|---|
| 2020/21 | 2021/22 | 2022/23 | |||||||
| Male | 5,984 | 3,361 | 9,345 | 6,904 | 2,952 | 9,856 | 7,608 | 2,979 | 10,587 |
| Female | 7,977 | 3,936 | 11,913 | 8,936 | 3,892 | 12,828 | 9,789 | 4,275 | 14,064 |
| Total* | 13,966 | 7,310 | 21,276 | 15,844 | 6,853 | 22,697 | 17,429 | 7,262 | 24,691 |
| % Male | 42.8% | 46.0% | 43.9% | 43.6% | 43.1% | 43.4% | 43.7% | 41.0% | 42.9% |
| % Female | 57.1% | 53.8% | 56.0% | 56.4% | 56.8% | 56.5% | 56.2% | 58.9% | 57.0% |
*Includes a number of students who have selected Other or Information Refused / Unknown as their gender
The biggest increase of students is female by 1,236 from 2021/22 to 2022/23. Males have increased by 731 from 2021/22 to 2022/23.
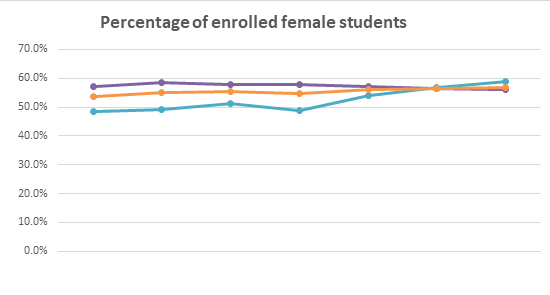
| 2016/2017 | 2017/2018 | 2018/2019 | 2019/2020 | 2020/2021 | 2021/2022 | 2022/2023 | |
|---|---|---|---|---|---|---|---|
| Full Time | 57.0% | 58.4% | 58.0% | 57.9% | 57.1% | 56.4% | 56.2% |
| Part Time | 48.3% | 49.3% | 51.4% | 49.0% | 53.8% | 56.8% | 58.9% |
| Total | 53.6% | 55.0% | 56.6% | 54.8% | 56.0% | 56.5% | 57.0% |
Female students make up more than half of the student cohort at the University at 57%.
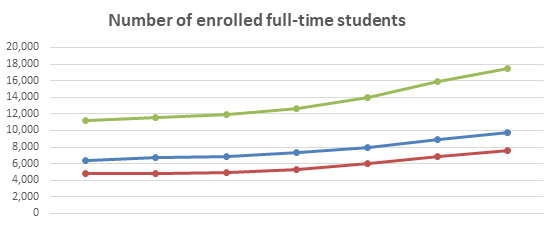
| 2016/2017 | 2017/2018 | 2018/2019 | 2019/2020 | 2020/2021 | 2021/2022 | 2022/2023 | |
|---|---|---|---|---|---|---|---|
| Male | 4,789 | 4,793 | 4,989 | 5,303 | 5,984 | 6,904 | 7,608 |
| Female | 6,362 | 6,728 | 6,885 | 7,310 | 7,977 | 8,936 | 9,789 |
| Total | 11,152 | 11,523 | 11,876 | 12,615 | 13,966 | 15,844 | 17,429 |
There has been an increase in both male and female students since 2016/17.
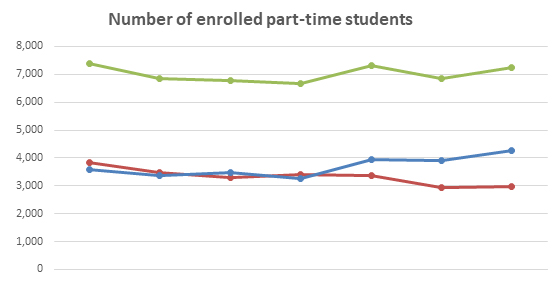
| 2016/2017 | 2017/2018 | 2018/2019 | 2019/2020 | 2020/2021 | 2021/2022 | 2022/2023 | |
|---|---|---|---|---|---|---|---|
| Male | 3,822 | 3,464 | 3,292 | 3,399 | 3,361 | 2,952 | 2,979 |
| Female | 3,577 | 3,388 | 3,488 | 3,269 | 3,936 | 3,892 | 4,275 |
| Total | 7,402 | 6,854 | 6,791 | 6,677 | 7,310 | 6,853 | 7,262 |
There has been increase of 27 male students on part-time courses with a larger increase in female students of 383 in 2022/23, following a pattern of fluctuation with both male and female students since 2017/18.
Benchmark Comparison
Source:HESA
| Gender | Benchmark | 2022 |
|---|---|---|
| Male | 57.0% | 56.5% |
| Female | 43.0% | 43.4%% |
*There is no available benchmarking data for 2023, benchmarking is based on 2022 data.
Religion and belief
The table below details information regarding the religion of students at Teesside University, and the comparisons between total students and those classed as non-Christian.
Students have been grouped into one of ten groups:
- Christian
- Buddhist
- Hindu
- Jewish
- Muslim
- Sikh
- Spiritual
- Other
- No religion
- Information refused/blank.
These are then grouped into Christian, Non-Christian (includes Buddhist, Hindu, Jewish, Muslim, Sikh, Spiritual and other) and No religion.
2022/23 enrolled students (all years, all modes)
| Religion | Full time | Part time | Total | Full time | Part time | Total | Full time | Part time | Total |
|---|---|---|---|---|---|---|---|---|---|
| 2020/21 | 2021/22 | 2022/23 | |||||||
| Christian | 3,634 | 1,927 | 5,561 | 5,617 | 2,629 | 8,246 | 6,726 | 2,852 | 9,578 |
| Buddhist | 86 | 27 | 113 | 78 | 38 | 116 | 128 | 44 | 172 |
| Hindu | 688 | 23 | 711 | 1,472 | 78 | 1,550 | 1,654 | 97 | 1,751 |
| Jewish | 5 | 1 | 6 | 3 | 2 | 5 | 5 | 6 | 11 |
| Muslim | 922 | 152 | 1,074 | 1,565 | 227 | 1,792 | 1,885 | 229 | 2,114 |
| Sikh | 49 | 9 | 58 | 40 | 18 | 58 | 56 | 12 | 68 |
| Spiritual | 103 | 50 | 153 | 151 | 72 | 223 | 2 | 3 | 5 |
| Other | 152 | 49 | 201 | 146 | 71 | 217 | 184 | 109 | 293 |
| No religion | 6,443 | 2,408 | 8,851 | 6,381 | 3,472 | 9,853 | 6,201 | 3,591 | 9,792 |
| Information refused/blank | 533 | 2,031 | 2,564 | 391 | 246 | 637 | 588 | 319 | 907 |
| Total* | 12,615 | 6,677 | 19,292 | 15,844 | 6,853 | 22,697 | 17,429 | 7,262 | 24,691 |
| Non-Christian | 2,005 | 311 | 2,316 | 3,455 | 506 | 3,961 | 3,914 | 500 | 4,414 |
| % Christian | 28.8% | 28.9% | 28.8% | 35.5% | 38.4% | 36.3% | 38.6% | 39.3% | 38.8% |
| % Non-Christian | 15.9% | 4.7% | 12.0% | 21.8% | 7.4% | 17.5% | 22.5% | 6.9% | 17.9% |
| % No religion | 51.1% | 36.1% | 45.9% | 40.3% | 50.7% | 43.4% | 35.6% | 49.4% | 39.7% |
The largest increase are Christian students by 1,332 from 2021/2022 to 2022/2023, followed by Muslim students.
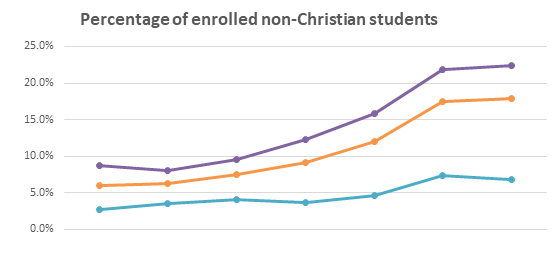
| 2016/2017 | 2017/2018 | 2018/2019 | 2019/2020 | 2020/2021 | 2021/2022 | 2022/2023 | |
|---|---|---|---|---|---|---|---|
| Full Time | 8.8% | 8.0% | 9.5% | 12.3% | 15.9% | 21.8% | 22.5% |
| Part Time | 2.8% | 3.6% | 4.1% | 3.7% | 4.7% | 7.4% | 6.9% |
| Total | 6.1% | 6.2% | 7.5% | 9.2% | 12.0% | 17.5% | 17.9% |
The percentage of Non-Christian students had increased year on year at a steady rate until 2022/23 where the percentage increase of 0.4% is lower than in previous years.
| 2016/2017 | 2017/2018 | 2018/2019 | 2019/2020 | 2020/2021 | 2021/2022 | 2022/2023 | |
|---|---|---|---|---|---|---|---|
| Christian | 3,143 | 3,284 | 3,437 | 3,438 | 3,634 | 5,617 | 6,726 |
| Non-Christian | 893 | 891 | 1,100 | 1,462 | 2,005 | 3,455 | 3,914 |
| No Religion | 4,991 | 5,526 | 6,032 | 6,259 | 6,443 | 6,381 | 6,201 |
| Info Refused/Blank | 1,154 | 1,451 | 954 | 717 | 533 | 391 | 588 |
| Total | 10,181 | 11,152 | 11,523 | 11,876 | 12,615 | 15,844 | 17,429 |
Information refused/blank has increased by 50.4% in 2022/23 with a decline of 2.8% in No religion.
| 2016/2017 | 2017/2018 | 2018/2019 | 2019/2020 | 2020/2021 | 2021/2022 | 2022/2023 | |
|---|---|---|---|---|---|---|---|
| Christian | 2,138 | 1,888 | 1,746 | 1,905 | 1,927 | 2,629 | 2,852 |
| Non-Christian | 234 | 267 | 279 | 254 | 311 | 506 | 500 |
| No Religion | 1,783 | 1,970 | 2,023 | 2,109 | 2,408 | 3,472 | 3,591 |
| Info Refused/Blank | 4,240 | 3,277 | 2,806 | 2,523 | 2,031 | 246 | 319 |
| Total | 8,395 | 7,402 | 6,854 | 6,791 | 6,677 | 6,853 | 7,262 |
No religion remains the highest category for part-time students in the past few years.
Benchmark Comparison
Source:HESA
| Religion and belief | Benchmark | 2022 |
|---|---|---|
| Christian | 31.0% | 36.3% |
| Non Christian | 23.0% | 17.5% |
| No religion | 47.0% | 43.4% |
*There is no available benchmarking data for 2023, benchmarking is based on 2022 data.
Sexual orientation
The tables below detail information regarding the sexual orientation of students at Teesside University and the comparisons between total students and those classed as heterosexual and non-heterosexual.
Students have been grouped into one of seven groups namely:
- Heterosexual;
- Bisexual;
- Gay Man;
- Gay Woman/Lesbian;
- Gay or Lesbian (New group in enrolments only);
- Information Refused/Blank;
- Other.
These are then grouped into three groups Heterosexual, Non-Heterosexual and Information refused.
2022/23 enrolled students (all years, all modes)
| Sexual Orientation | Full time | Part time | Total | Full time | Part time | Total | Full time | Part time | Total |
|---|---|---|---|---|---|---|---|---|---|
| 2020/21 | 2021/22 | 2022/23 | |||||||
| Heterosexual | 11,386 | 4,971 | 16,357 | 13,026 | 4,891 | 17,917 | 13,915 | 6,117 | 20,032 |
| Bisexual | 673 | 99 | 772 | 873 | 123 | 996 | 908 | 208 | 1,116 |
| Gay man | 180 | 68 | 248 | 186 | 78 | 264 | 2 | 1 | 3 |
| Gay Woman/ Lesbian | 218 | 71 | 289 | 223 | 62 | 285 | 2 | 3 | |
| Gay or Lesbian | 338 | 198 | 536 | ||||||
| Other | 315 | 52 | 367 | 399 | 45 | 444 | 212 | 40 | 252 |
| Info Refused/ Blank | 1,194 | 2,049 | 3,243 | 1,137 | 1,654 | 2,791 | 2,052 | 698 | 2,750 |
| Total | 13,966 | 7,310 | 21,276 | 15,844 | 6,853 | 22,697 | 17,429 | 7,262 | 24,691 |
| Non-Heterosexual | 1,386 | 290 | 1,676 | 1,681 | 308 | 1,989 | 1,462 | 447 | 1,909 |
| % Heterosexual | 81.5% | 68.0% | 76.9% | 82.2% | 71.4% | 78.9% | 79.8% | 84.2% | 81.1% |
| % Non-Heterosexual | 9.9% | 4.0% | 7.9% | 10.6% | 4.5% | 8.8% | 8.4% | 6.2% | 7.7% |
The largest increase are Heterosexual students with an increase of 2115 from 2021/2022 to 2022/23. Categories for sexual orientation have been revised in 2023 to match with Higher Education Statistics agency (HESA) therefore there are gaps in the data.
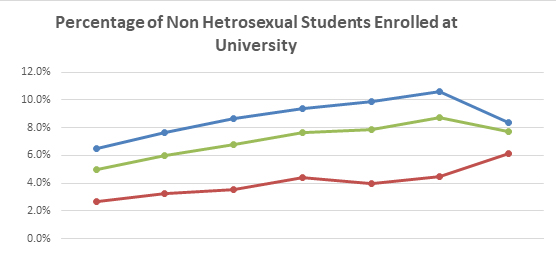
| 2016/2017 | 2017/2018 | 2018/2019 | 2019/2020 | 2020/2021 | 2021/2022 | 2022/2023 | |
|---|---|---|---|---|---|---|---|
| Full Time | 6.5% | 7.7% | 8.6% | 9.4% | 9.9% | 10.6% | 8.4% |
| Part Time | 2.7% | 3.3% | 3.5% | 4.4% | 4.0% | 4.5% | 6.2% |
| Total | 5.0% | 6.0% | 6.8% | 7.7% | 7.9% | 8.8% | 7.7% |
The number of Information Refused/Blank responses have decreased by 2,244 since 2016/17 but still remains the second highest group. Due to this decrease both the percentage and actuals for Heterosexual students have increased whilst the same for Non-Heterosexual students until 2022/23 where both actual and percentage decreased due to reduced figures under Other.
| 2016/2017 | 2017/2018 | 2018/2019 | 2019/2020 | 2020/2021 | 2021/2022 | 2022/2023 | |
|---|---|---|---|---|---|---|---|
| Heterosexual | 8,839 | 9,497 | 9,560 | 10,264 | 11,386 | 13,026 | 13,915 |
| Non-Heterosexual | 721 | 883 | 1,025 | 1,186 | 1,386 | 1,681 | 1,462 |
| Info Refused/Blank | 1,592 | 1,143 | 1,291 | 1,165 | 1,194 | 1,137 | 2,052 |
| Total | 11,152 | 11,523 | 11,876 | 12,615 | 13,966 | 15,844 | 17,429 |
The number of Information Refused/Blank responses have decreased from 2016/17 until 2018/19 with an increase of 148 before another reduction the following year, responses have continued to increase again since 2020/21. Both the percentage and actuals for Heterosexual and non-Heterosexual students have increased until 2022/23 where there is a drop in Non-Heterosexual students.
| 2016/2017 | 2017/2018 | 2018/2019 | 2019/2020 | 2020/2021 | 2021/2022 | 2022/2023 | |
|---|---|---|---|---|---|---|---|
| Heterosexual | 3,802 | 3,726 | 3,875 | 4,238 | 4,971 | 4,891 | 6,117 |
| Non-Heterosexual | 198 | 224 | 241 | 296 | 290 | 308 | 447 |
| Info Refused/Blank | 3,402 | 2,904 | 2,675 | 2,143 | 2,049 | 1,654 | 698 |
| Total | 7,408 | 6,854 | 6,791 | 6,677 | 7,310 | 6,853 | 7,262 |
The number Information Refused/Blank responses have decreased since 2016/17. Non-Heterosexual percentages and actuals have remained relatively static during same period whist Heterosexual students increased with exception of 2021/22 where there was a slight decrease of 80 students.
The UK census 2021 figure for LGB+ aged 16 years and over is 3.2%. The University figure is much higher and stands at 7.7%.